7. CI/CD Project with OWASP, Trivy, Sonarqube,Kubernetes, ArgoCD, Prometheus

"Hello, I'm Kiran Pawar, a passionate Cloud and Devops Engineer with a strong background in cloud automation, configuration, and deployment. My journey in the world of technology has been a thrilling adventure, where I've had the privilege to work with cutting-edge tools and practices.
🚀 As a DevOps Engineer:
I specialize in automating, configuring, and deploying instances in cloud environments and data centers. My expertise extends to DevOps, GitOps, CI/CD pipeline management, HashiCorp Terraform, and containerization. I'm proficient in AWS and Linux/Unix administration, ensuring robust infrastructure and application performance.
🔧 My Tech Stack:
Front-end skills: HTML, CSS, SCSS, Tailwind CSS, Bootstrap, React, Material-UI, JavaScript DevOps toolbox: GIT, OWASP,Nexus,Trivy, Github, Gitlab, Terraform, Ansible, Docker, Kubernetes, Helm, Jenkins, Prometheus, Grafana, Argo CD, AWS EKS.
🌐 My Cloud Expertise:
I have hands-on experience managing AWS services, including EC2, S3, EBS, VPC, ELB, RDS, IAM, Route53, and more.
🔒 Networking and Security:
My skills include managing networking concepts such as TCP/IP protocols, security policies, and subnet interfacing. I have a strong understanding of infrastructure and networking, covering topics like firewalls, IP addressing, DNS, and more.
💡 What Sets Me Apart:
I bring a positive attitude, a strong work ethic, and a collaborative spirit to every project. I'm a self-starter, a fast learner, and an effective team player with strong interpersonal skills. In addition to my DevOps skills, I've developed shell scripts (Bash) for automating tasks and have proficiency in Python scripting. My ability to communicate and manage projects, along with a track record of resolving client issues, adds value to every team I work with. If you're looking for a DevOps engineer who is also well-versed in front-end technologies, feel free to connect with me. Let's explore new possibilities and create exceptional technical solutions together!"

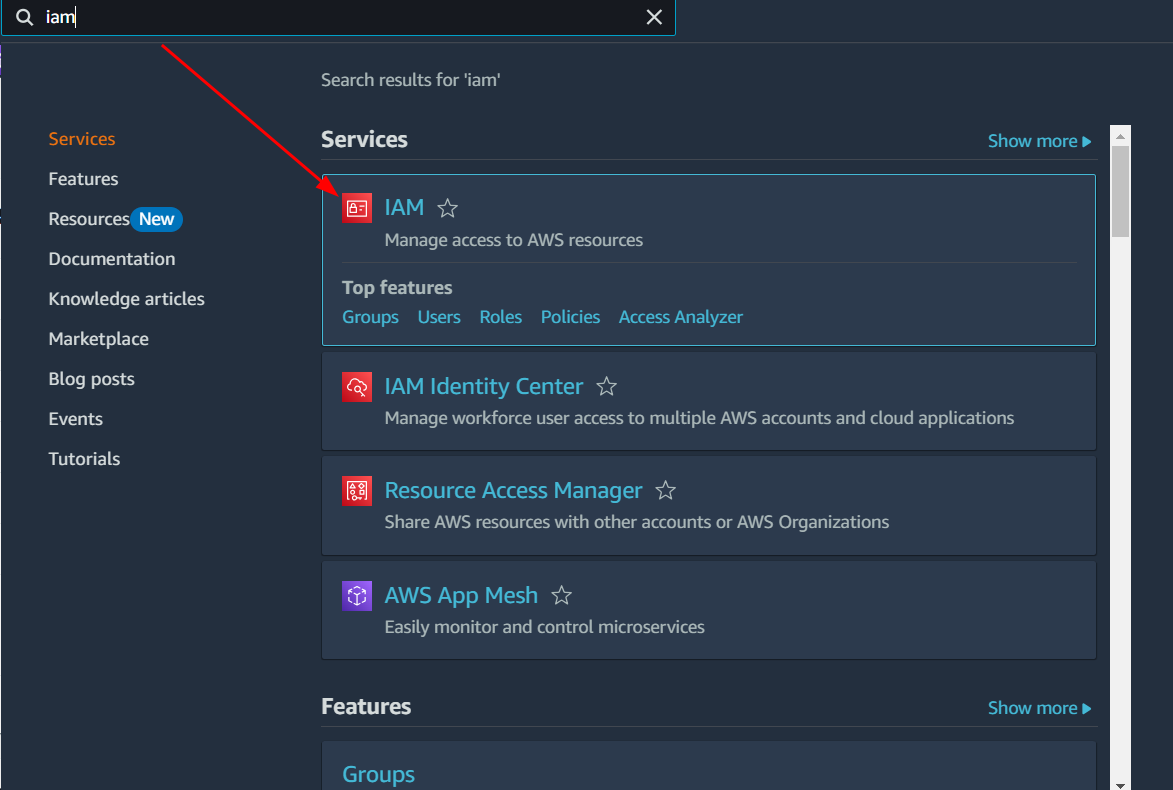
Set Up a New User
Navigate to the AWS IAM service
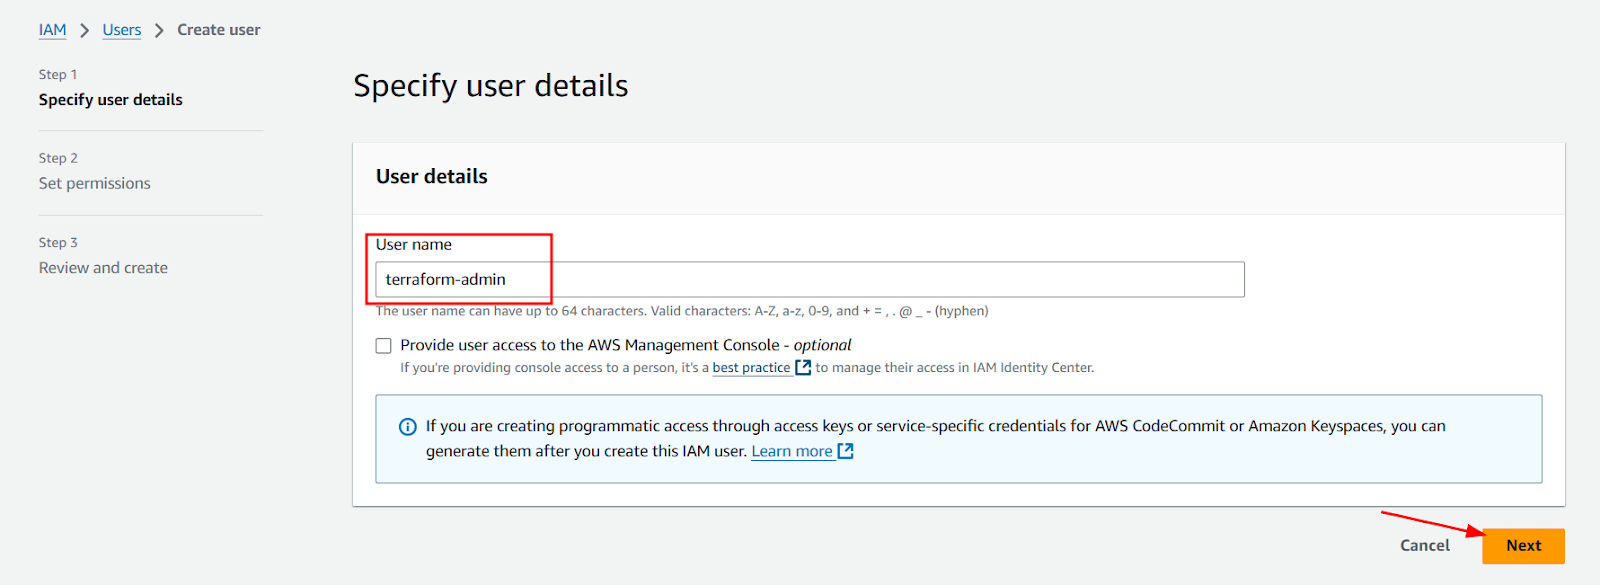
Create a user named terraform-admin.
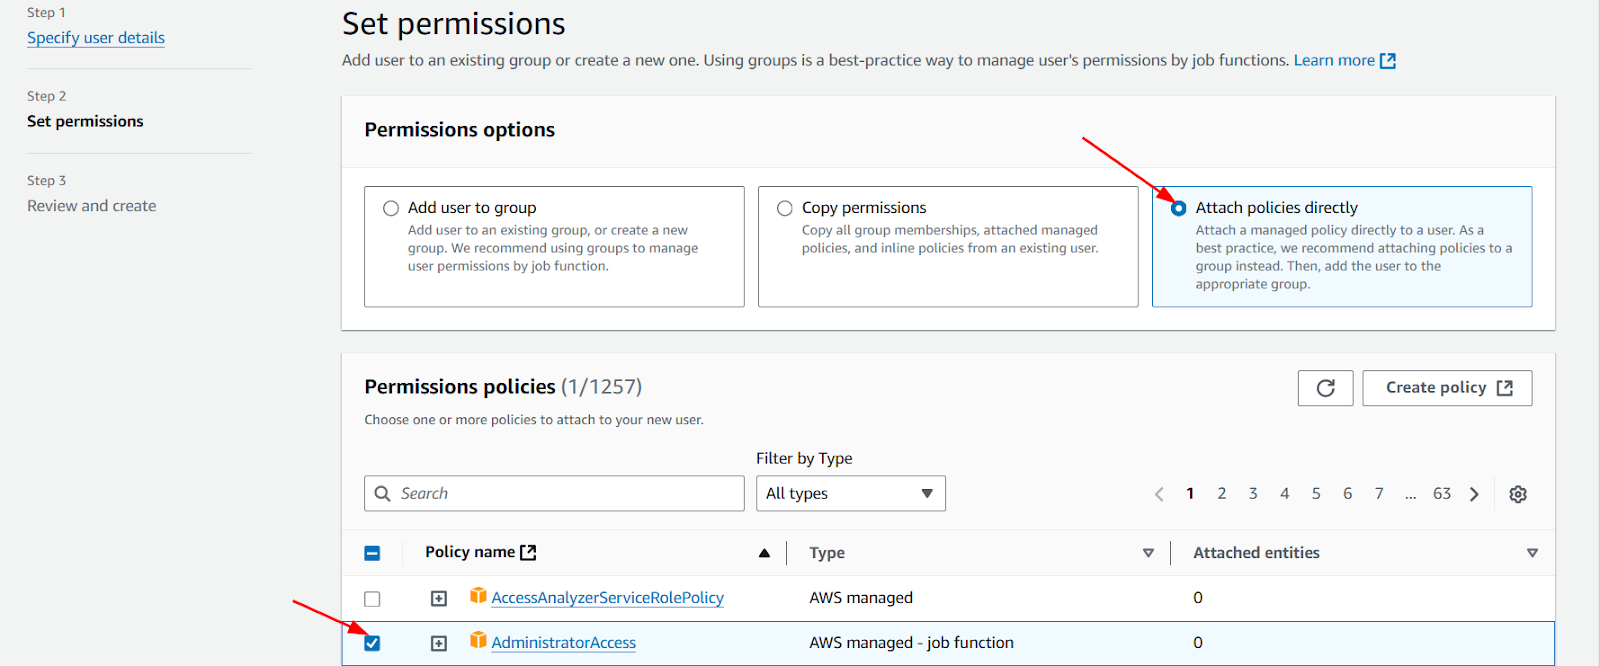
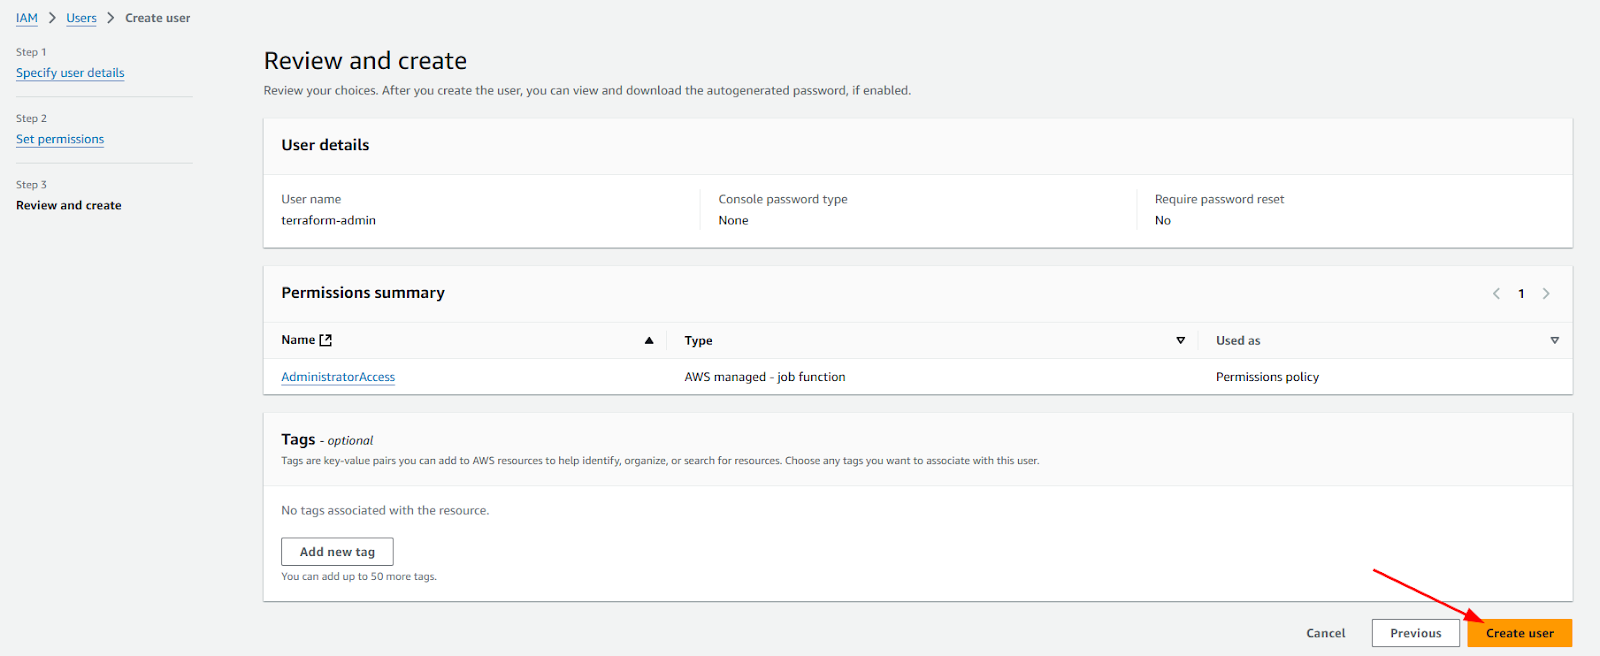
Assign admin access policy to the terraform-admin user
Then go to security credentials.
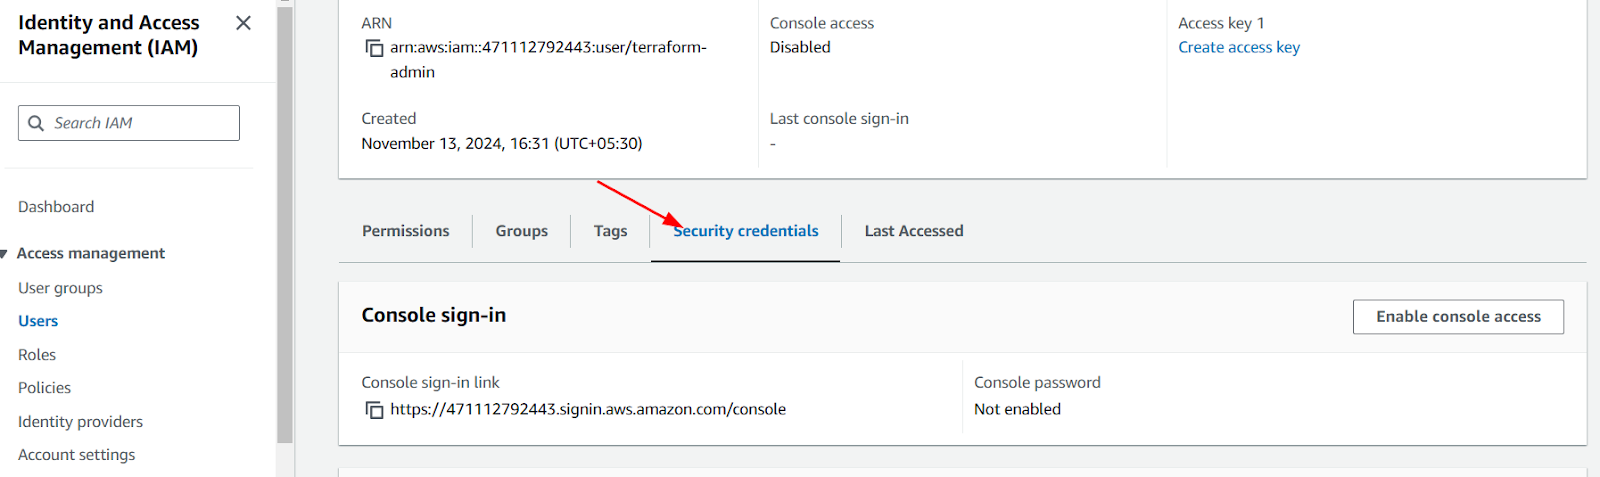
Create access keys
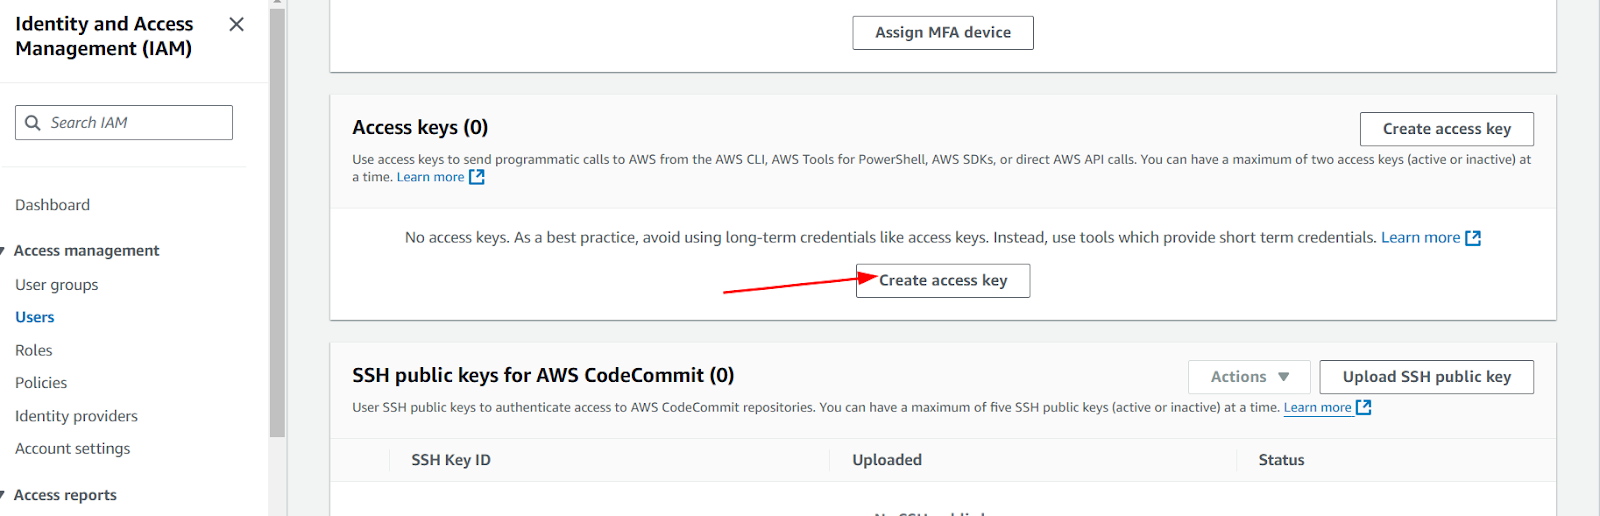
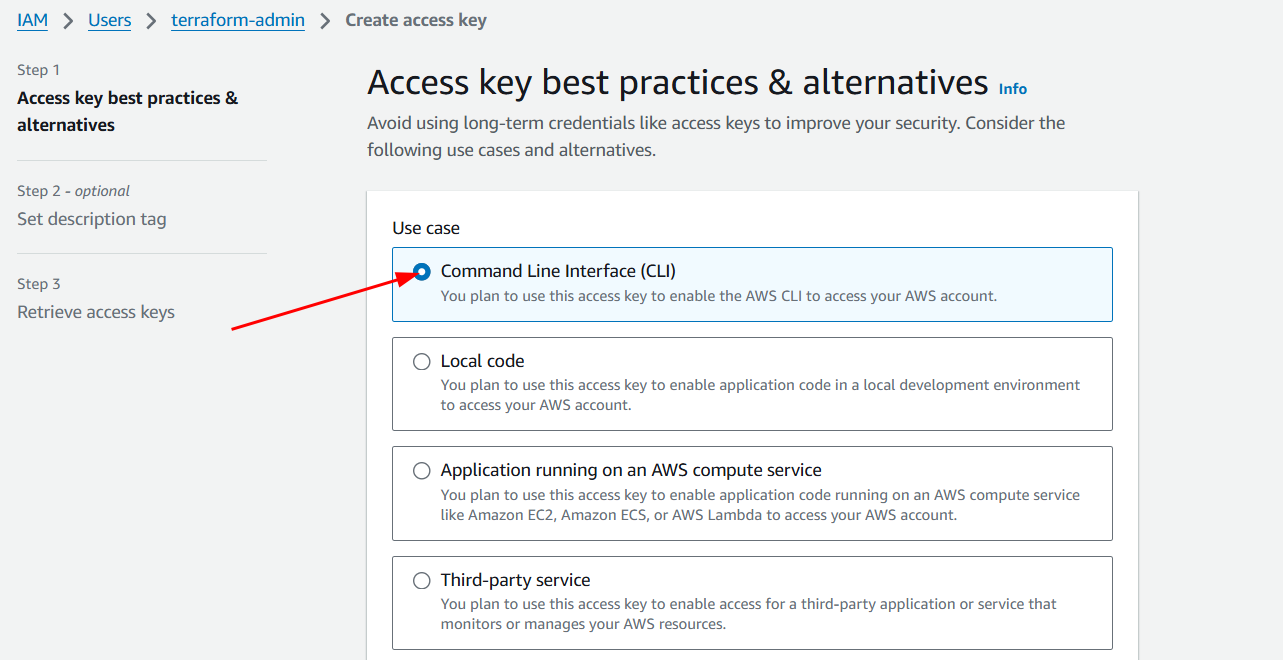
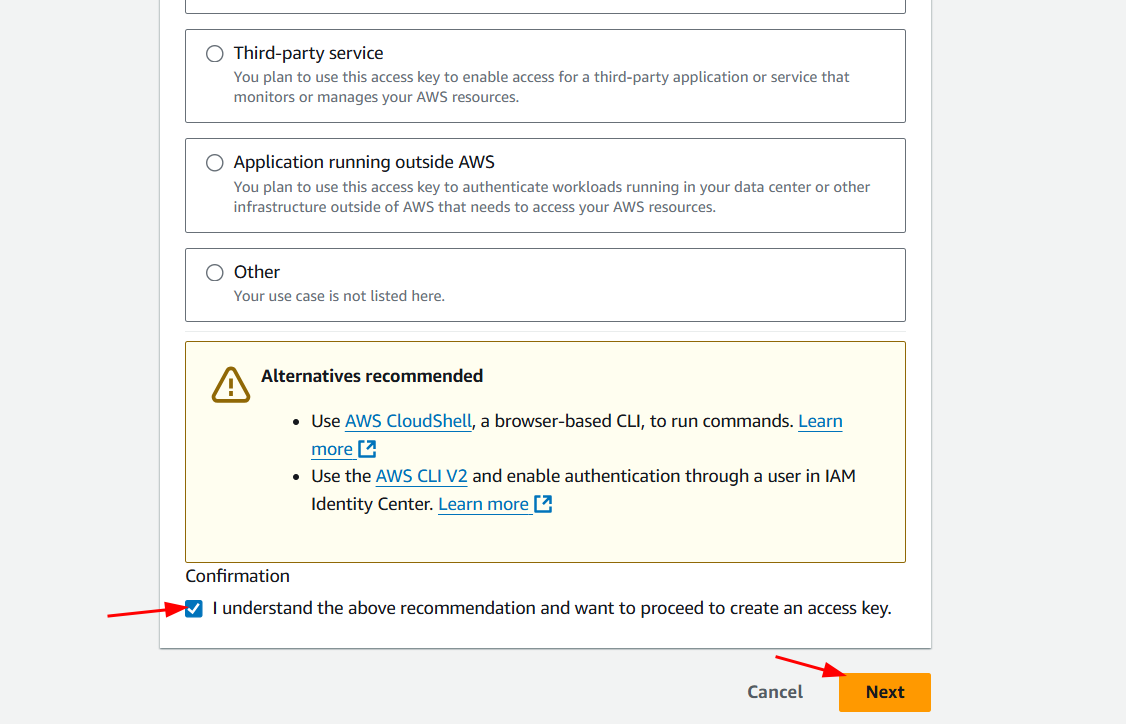
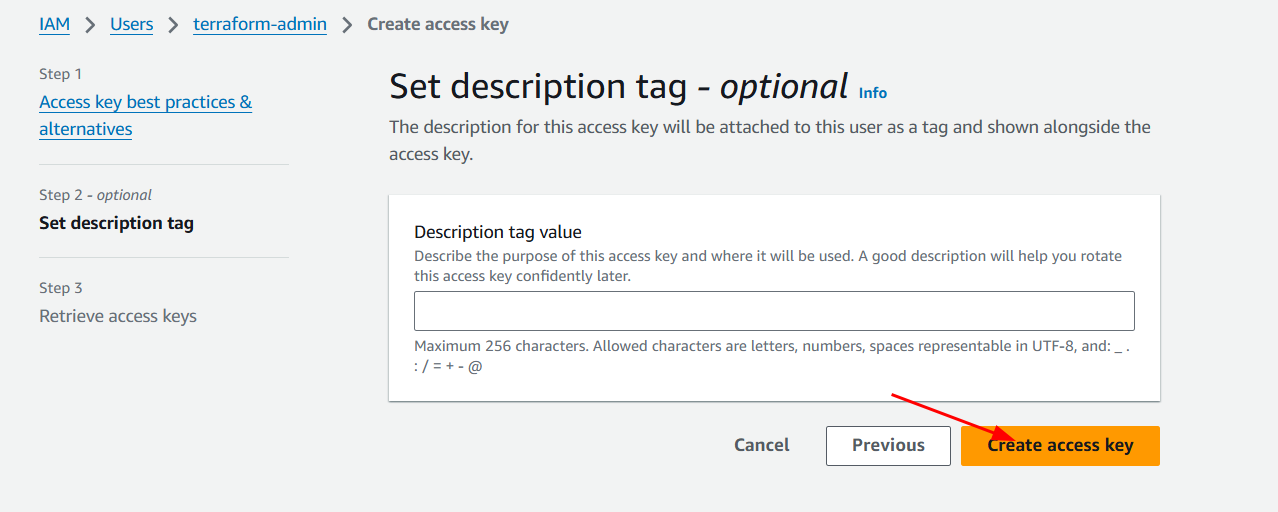
Download access keys and save it

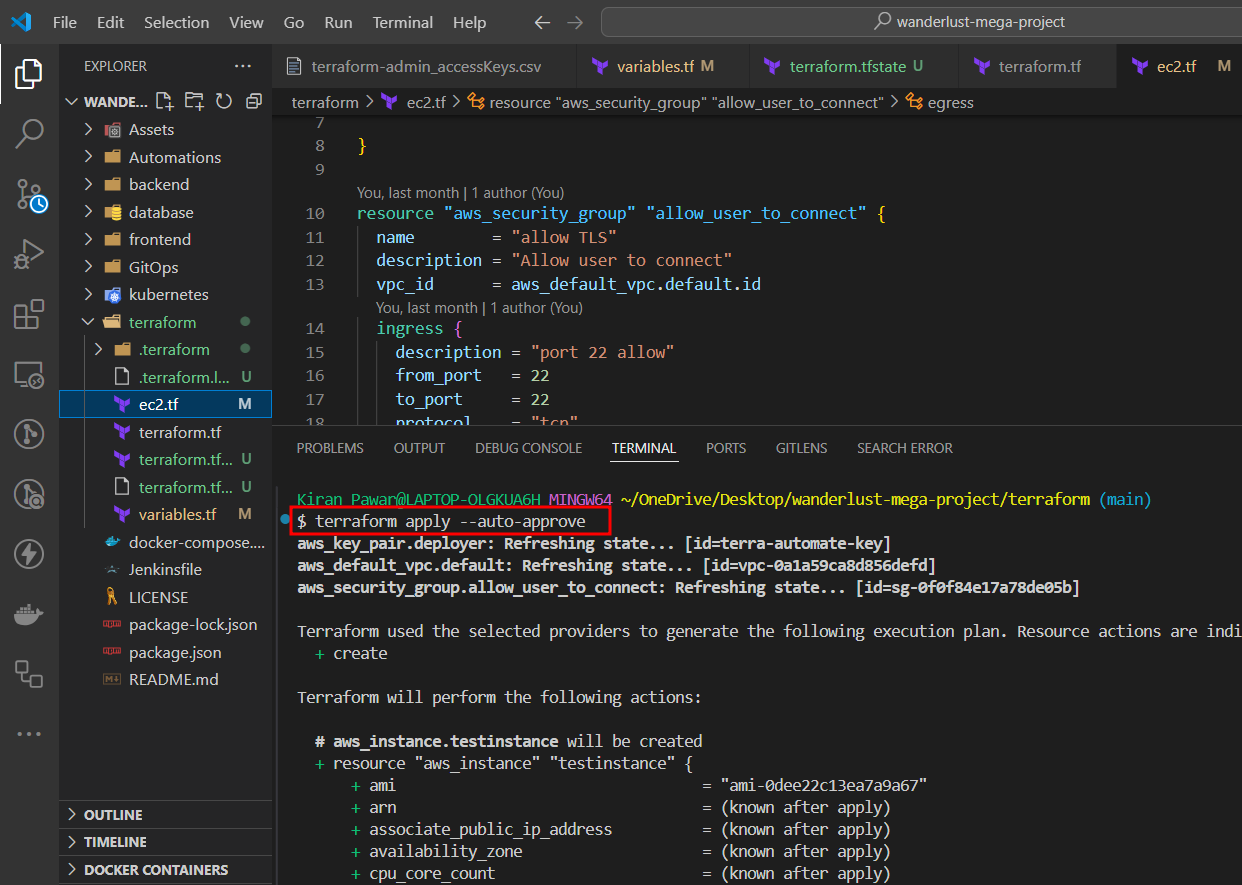
Create infra using terraform
Open folder project and search for terraform directory open it and configure aws using access key and secret keys
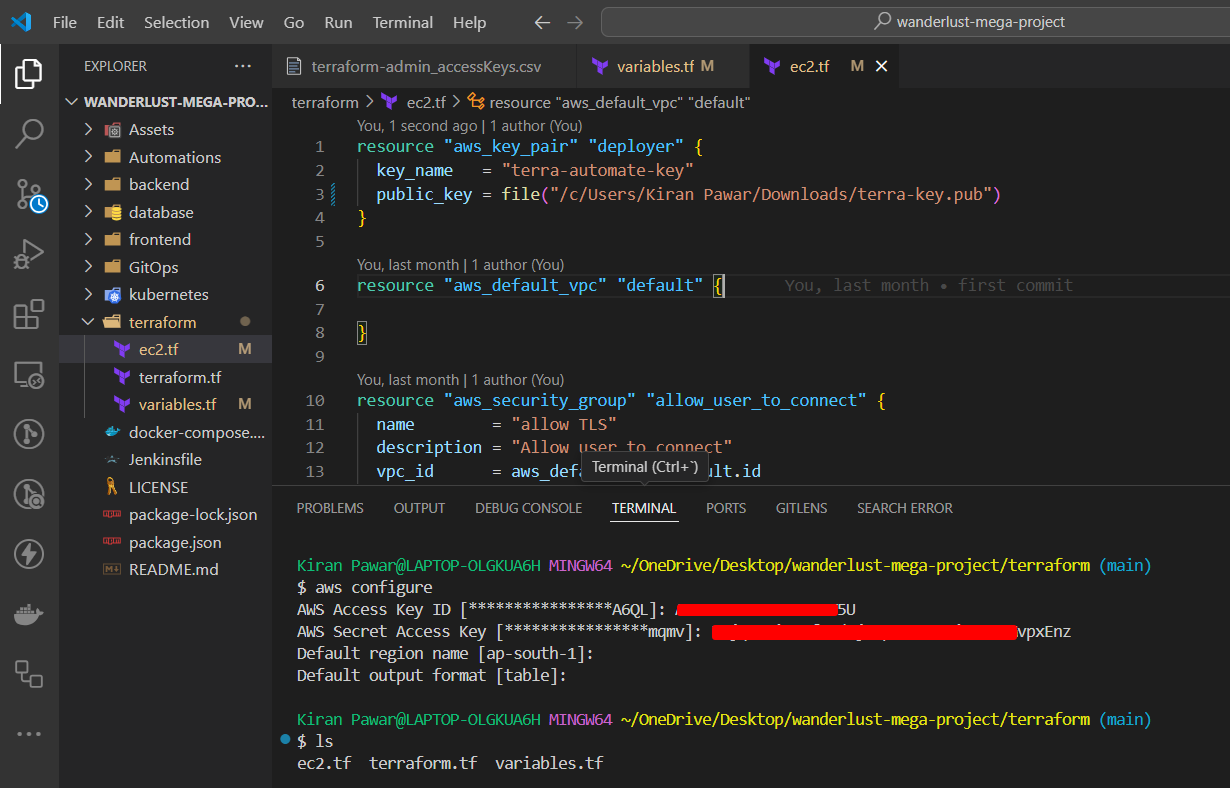
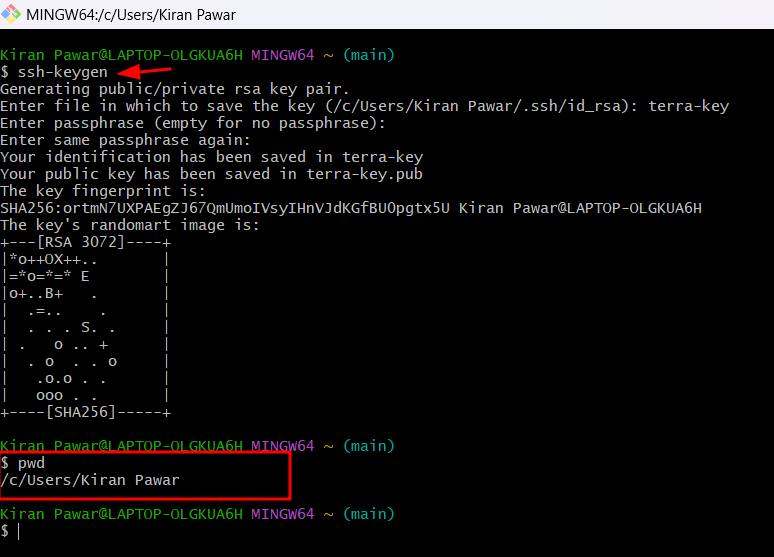
Create public key on your local and use it to launch ec2 server using terraform (terraform needs to be pre installed on your local)
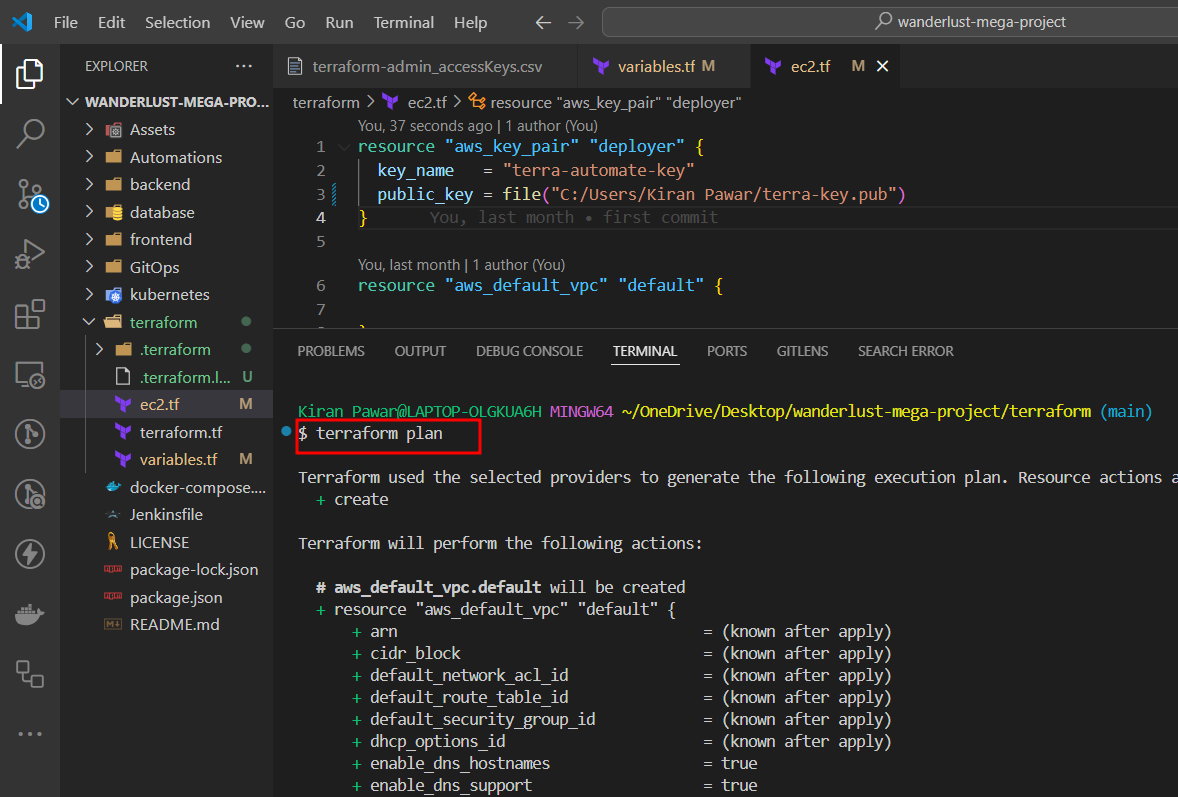
Apply Terraform command to create Infra

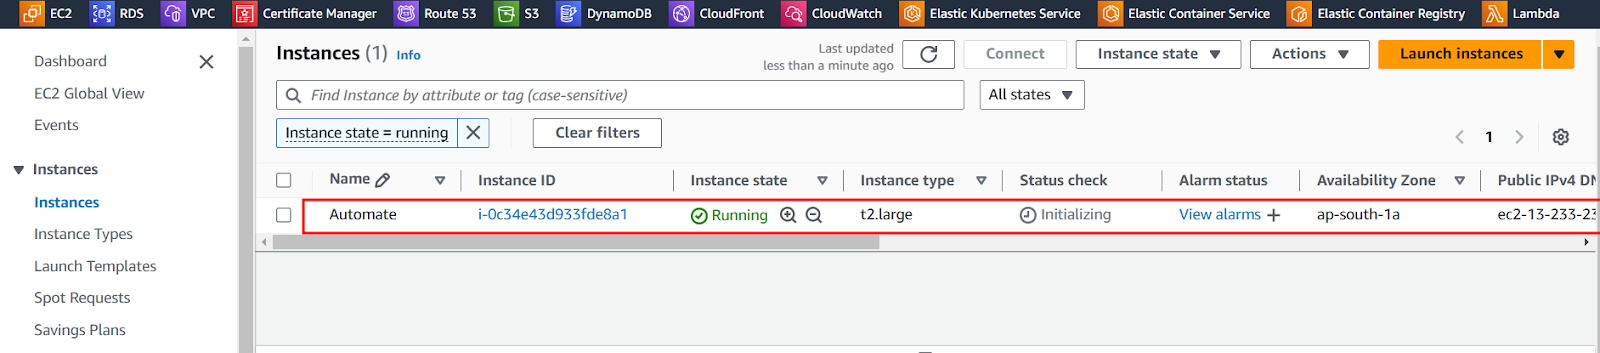
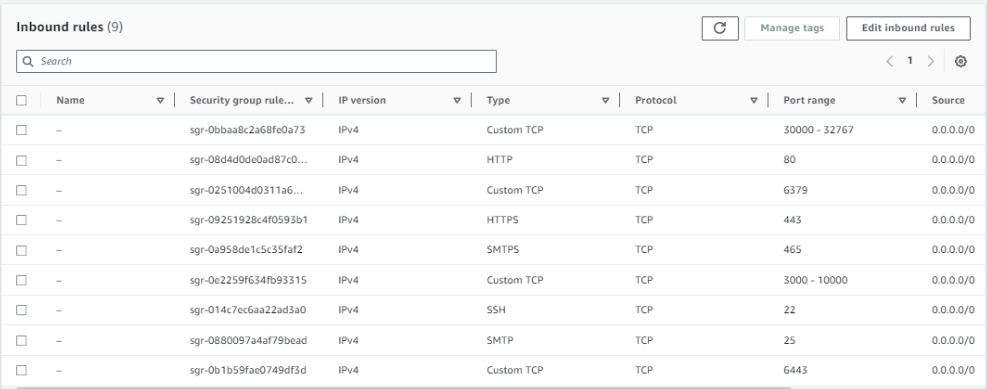
Open the below ports in security group of master machine and also attach same security group to Jenkins worker node (We will create worker node shortly)
Connect to Automate server and install below packages
Install & Configure Docker (Master machine)
using below command, "newgrp docker" will refresh the group config hence no need to restart the EC2 machine.
sudo apt-get update
sudo apt-get install docker.io -y
sudo usermod -aG docker ubuntu && newgrp docker
Install and configure Jenkins (Master machine)
sudo apt update -y
sudo apt install fontconfig openjdk-17-jre -y

sudo wget -O /usr/share/keyrings/jenkins-keyring.asc \
  https://pkg.jenkins.io/debian-stable/jenkins.io-2023.key

echo "deb [signed-by=/usr/share/keyrings/jenkins-keyring.asc]" \
  https://pkg.jenkins.io/debian-stable binary/ | sudo tee \
  /etc/apt/sources.list.d/jenkins.list > /dev/null

sudo apt-get update -y
sudo apt-get install jenkins -y
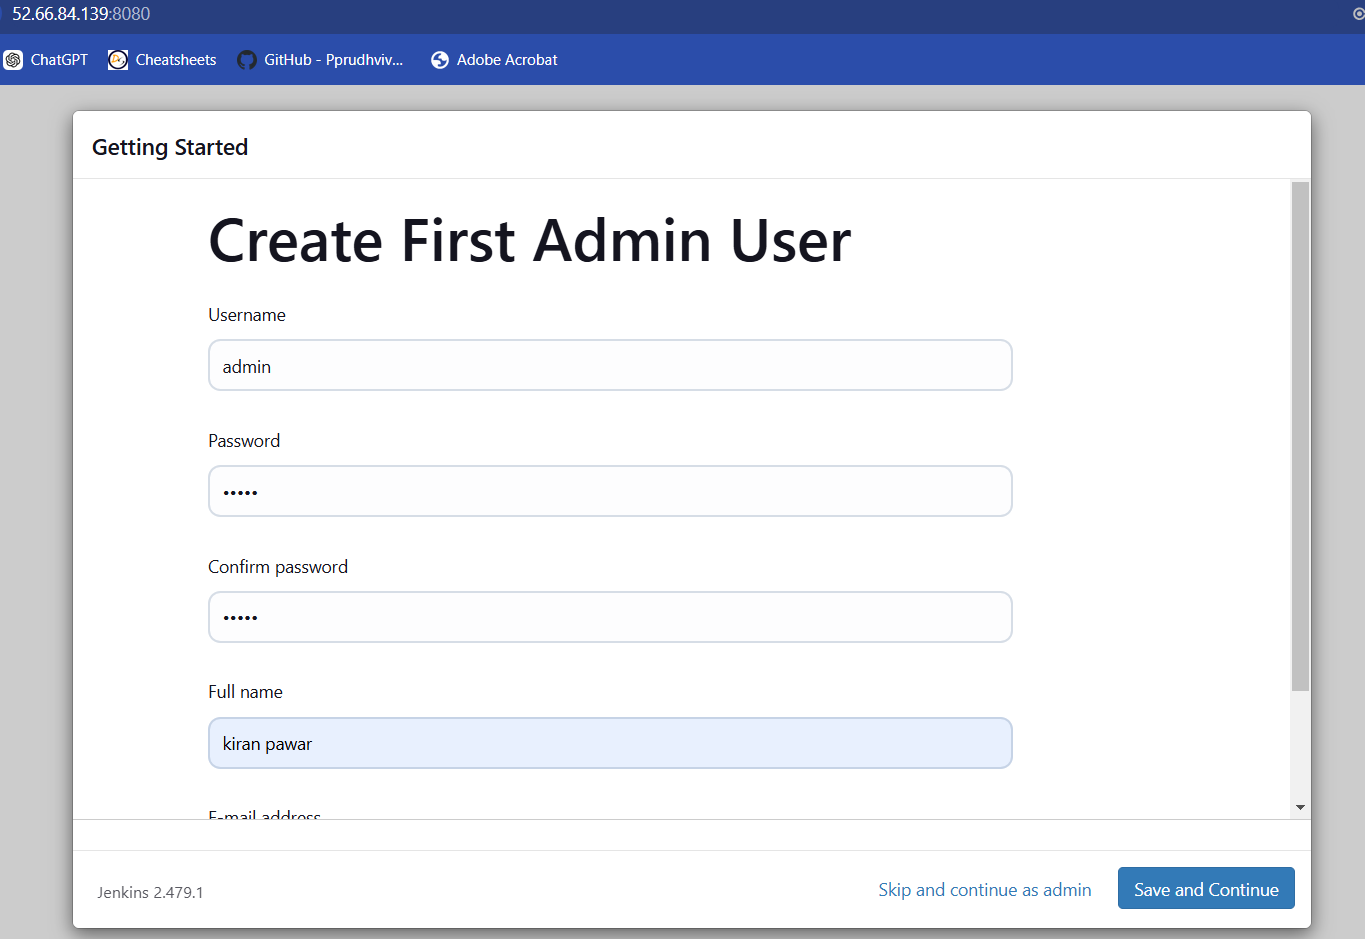
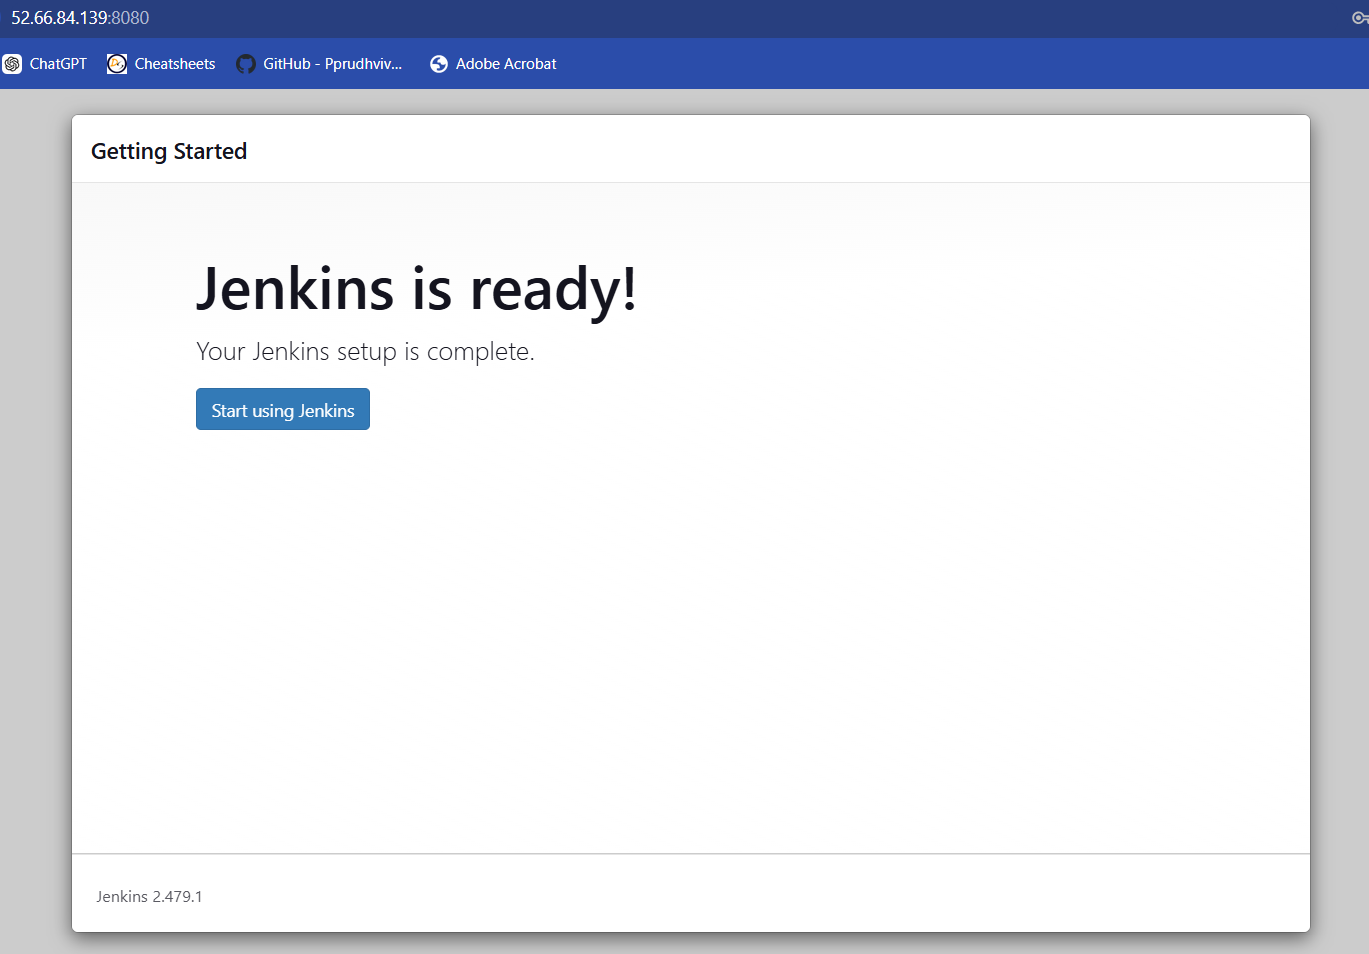
access Jenkins Master on the browser on port 8080 and configure it
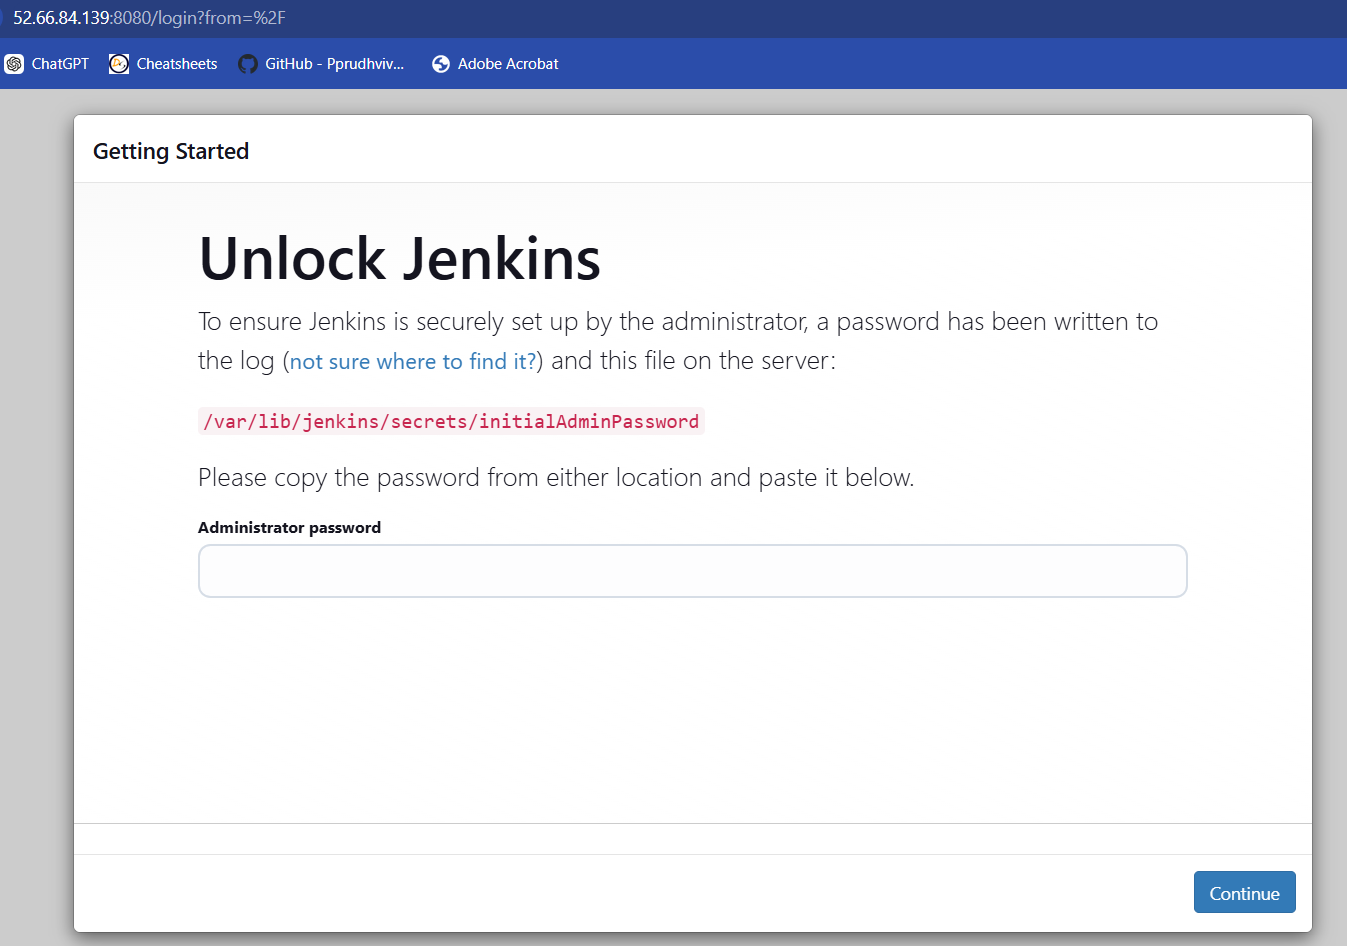
Use below command to get jenkins password
sudo cat /var/lib/jenkins/secrets/initialAdminPassword

Create EKS Cluster on AWS (Master machine)
IAM user with access keys and secret access keys
AWS CLI should be configured
curl "https://awscli.amazonaws.com/awscli-exe-linux-x86_64.zip" -o "awscliv2.zip"
sudo apt install unzip
unzip awscliv2.zip
sudo ./aws/install
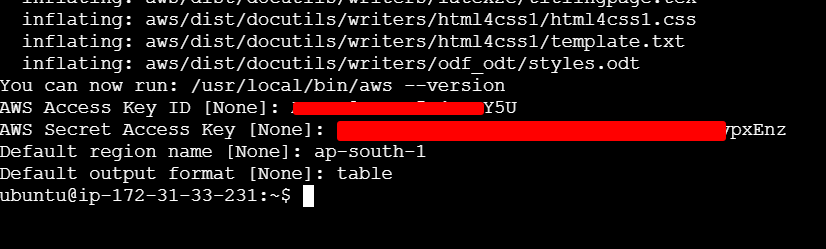
- Configure AWSCLI
aws configure
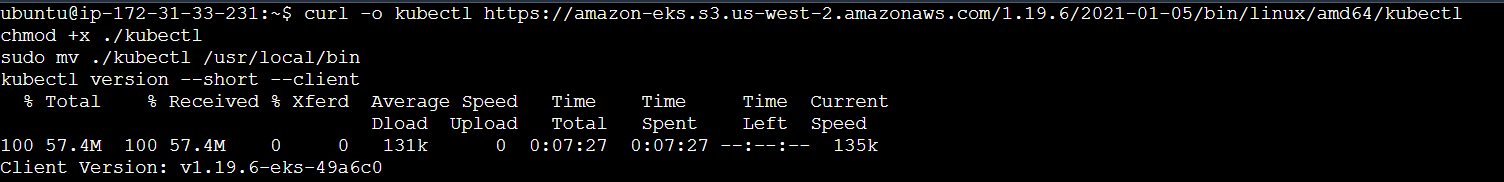
Install kubectl (Master machine)
curl -o kubectl https://amazon-eks.s3.us-west-2.amazonaws.com/1.19.6/2021-01-05/bin/linux/amd64/kubectl
chmod +x ./kubectl
sudo mv ./kubectl /usr/local/bin
kubectl version --short --client
Install eksctl (Master machine)
curl --silent --location "https://github.com/weaveworks/eksctl/releases/latest/download/eksctl_$(uname -s)_amd64.tar.gz" | tar xz -C /tmp
sudo mv /tmp/eksctl /usr/local/bin
eksctl version

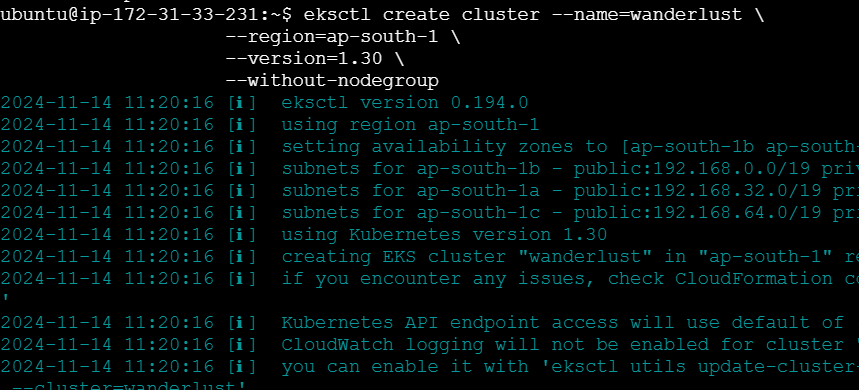
Create EKS Cluster (Master machine)
- Create EKS Cluster (Master machine)
eksctl create cluster --name=wanderlust \
                    --region=ap-south-1 \
                    --version=1.30 \
                    --without-nodegroup
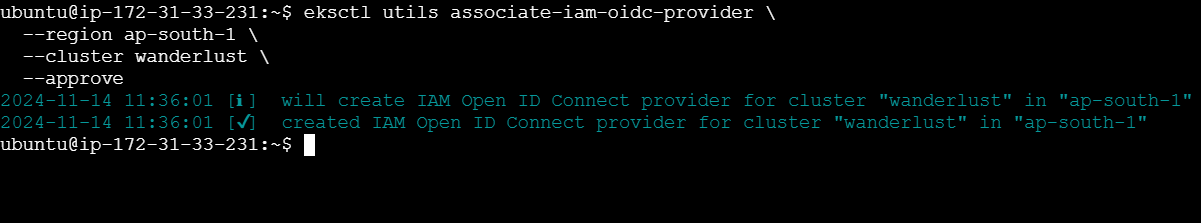
- Associate IAM OIDC Provider (Master machine)
eksctl utils associate-iam-oidc-provider \
--region ap-south-1 \
  --cluster wanderlust \
  --approve
Note
Make sure the ssh-public-key "eks-nodegroup-key is available in your aws account" so create one
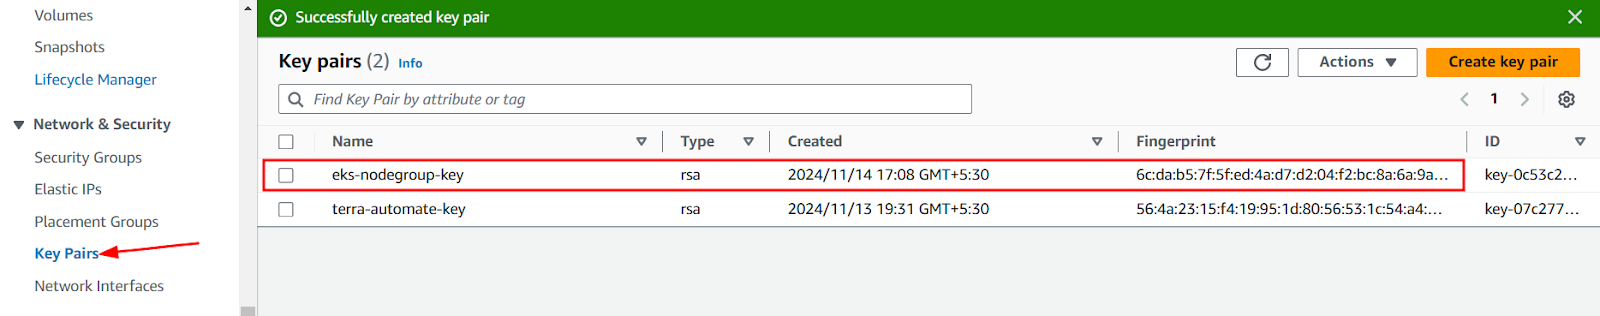
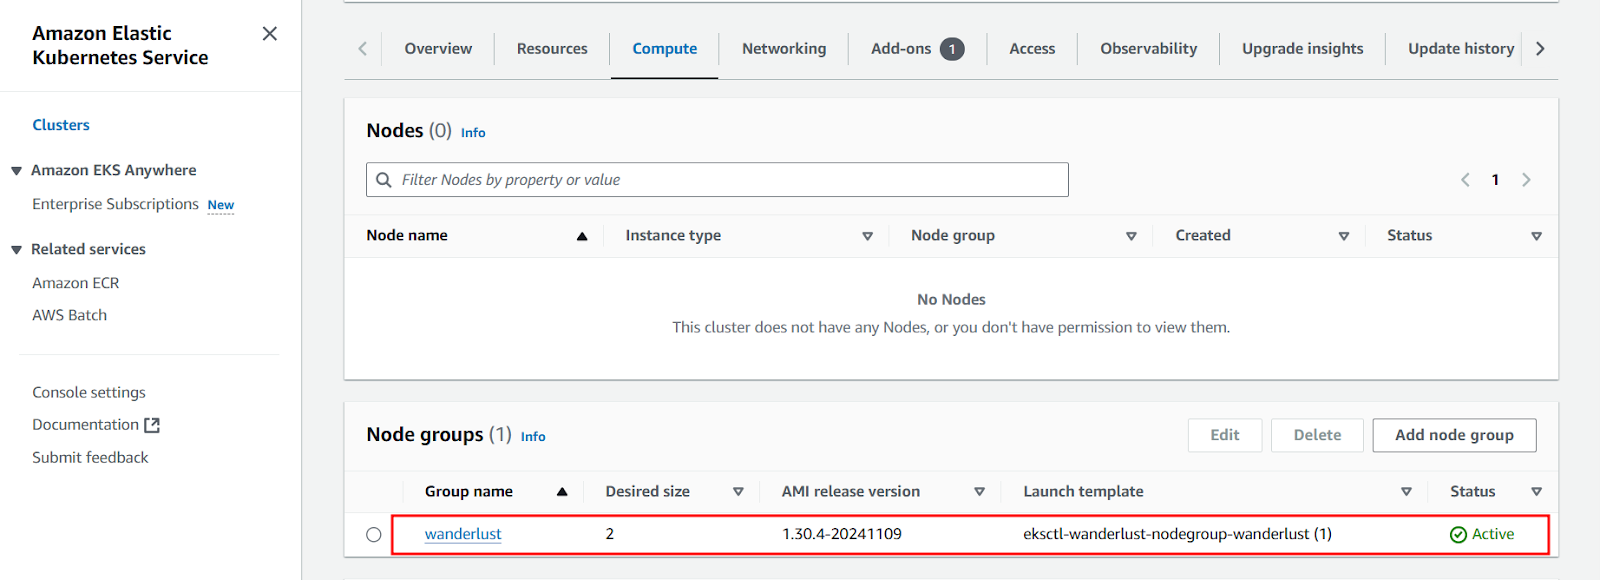
Create Nodegroup (Master machine)
eksctl create nodegroup --cluster=wanderlust \
                    --region=ap-south-1 \
                     --name=wanderlust \
                     --node-type=t2.large \
                     --nodes=2 \
                     --nodes-min=2 \
                     --nodes-max=2 \
                     --node-volume-size=29 \
                     --ssh-access \
                     --ssh-public-key=eks-nodegroup-key

Go to jenkins (master node)
install Trivy on the master machine
1. Install Required Dependencies
sudo apt-get install wget apt-transport-https gnupg lsb-release -y
2. Add the Trivy Repository Key
wget -qO - https://aquasecurity.github.io/trivy-repo/deb/public.key | sudo apt-key add -
3. Add the Trivy Repository
echo deb https://aquasecurity.github.io/trivy-repo/deb $(lsb_release -sc) main | sudo tee -a /etc/apt/sources.list.d/trivy.list
4. Update Package Lists
sudo apt-get update -y
5. Install Trivy
sudo apt-get install trivy -y
Verify Installation
trivy --version
Install and configure SonarQube (Master machine)
To install and configure SonarQube on a master machine using Docker, follow these steps:
1. Pull the SonarQube Image
docker pull sonarqube:lts-community
2. Run the SonarQube Container
docker run -itd --name SonarQube-Server -p 9000:9000 sonarqube:lts-community
This runs SonarQube in detached mode (-d) and maps port 9000 from the container to the host.
3. Check Running Containers
docker ps
Ensure the SonarQube-Server container is running.

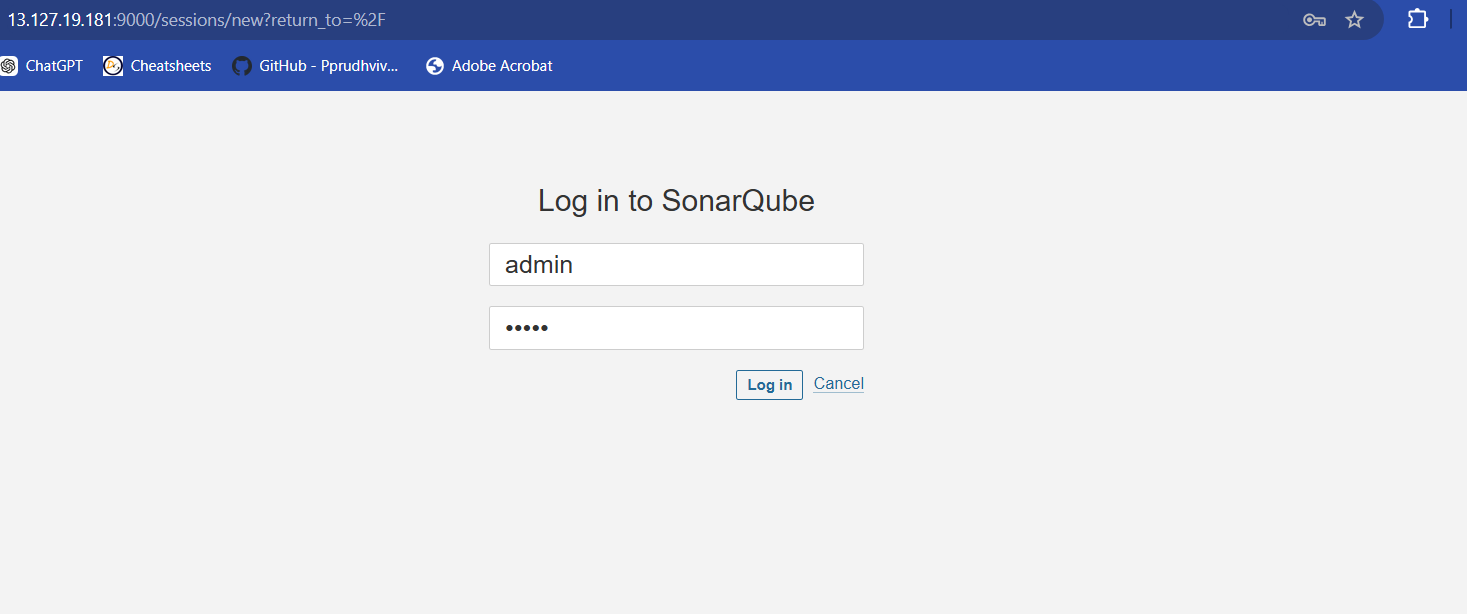
4. Access SonarQube Web UI
- Open your browser and go to:
http://localhost:9000 (or replacelocalhostwith your server IP)
5. Login to SonarQube
Default username:
adminDefault password:
admin
6. Change the Admin P****assword
After logging in, change the admin password for security.
Steps to add email notification
we need to generate an application password from our gmail account to authenticate with jenkins
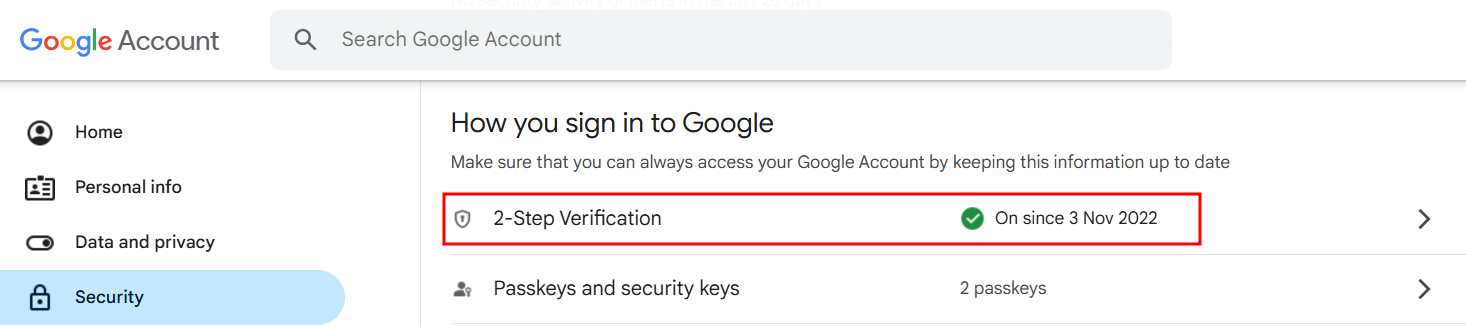
Open gmail and go to Manage your Google Account --> Securit****y
Important
Make sure 2 step verification must be on
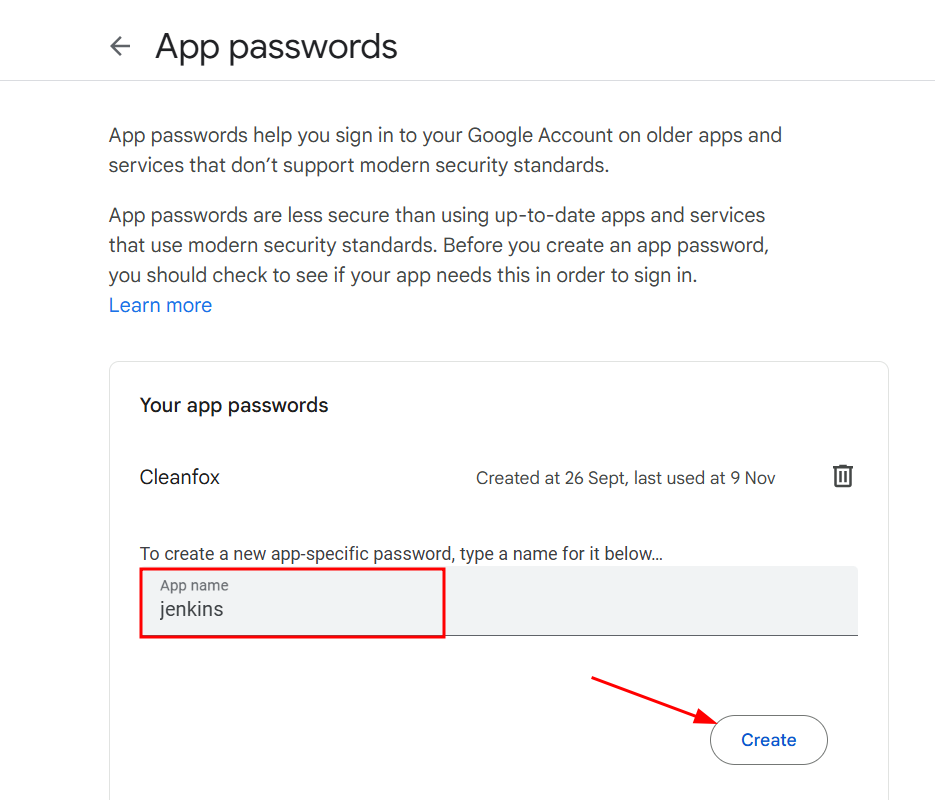
Search for App password and create a app password for jenkins

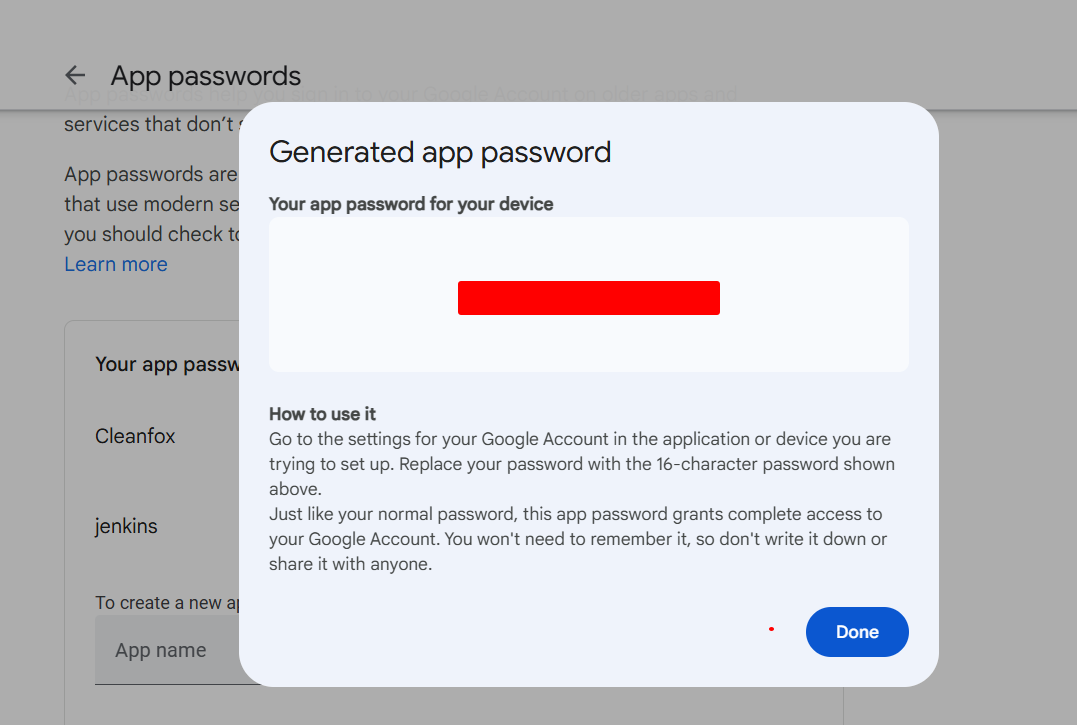
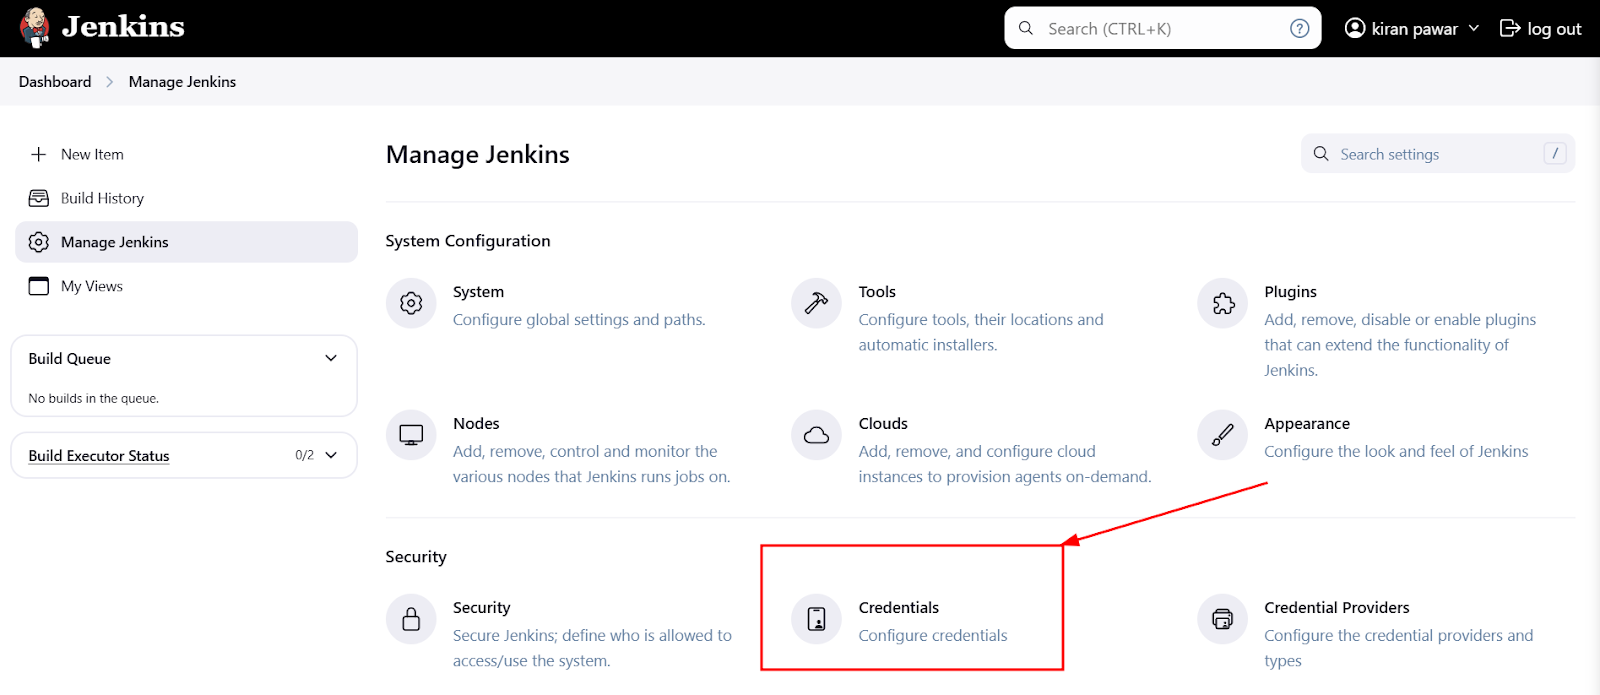
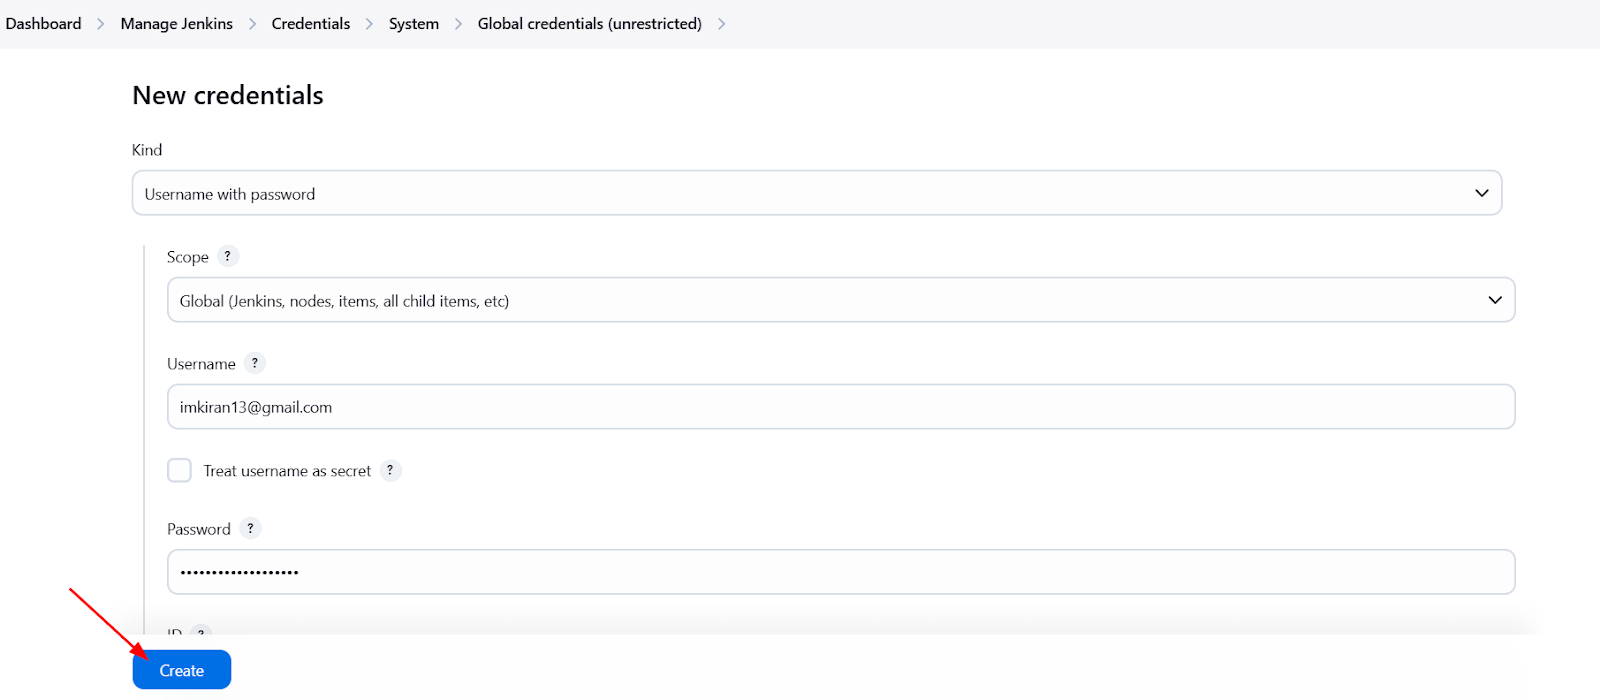
Once, app password is create and go back to jenkins Manage Jenkins --> Credentials to add username and password for email notification


Go back to Manage Jenkins --> System
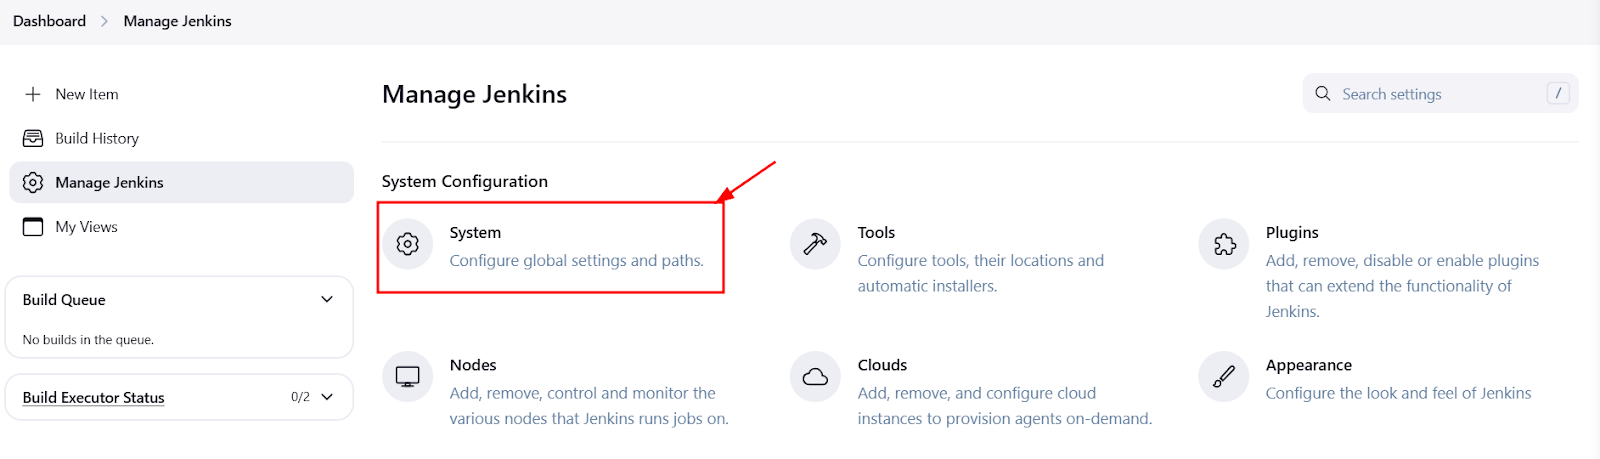
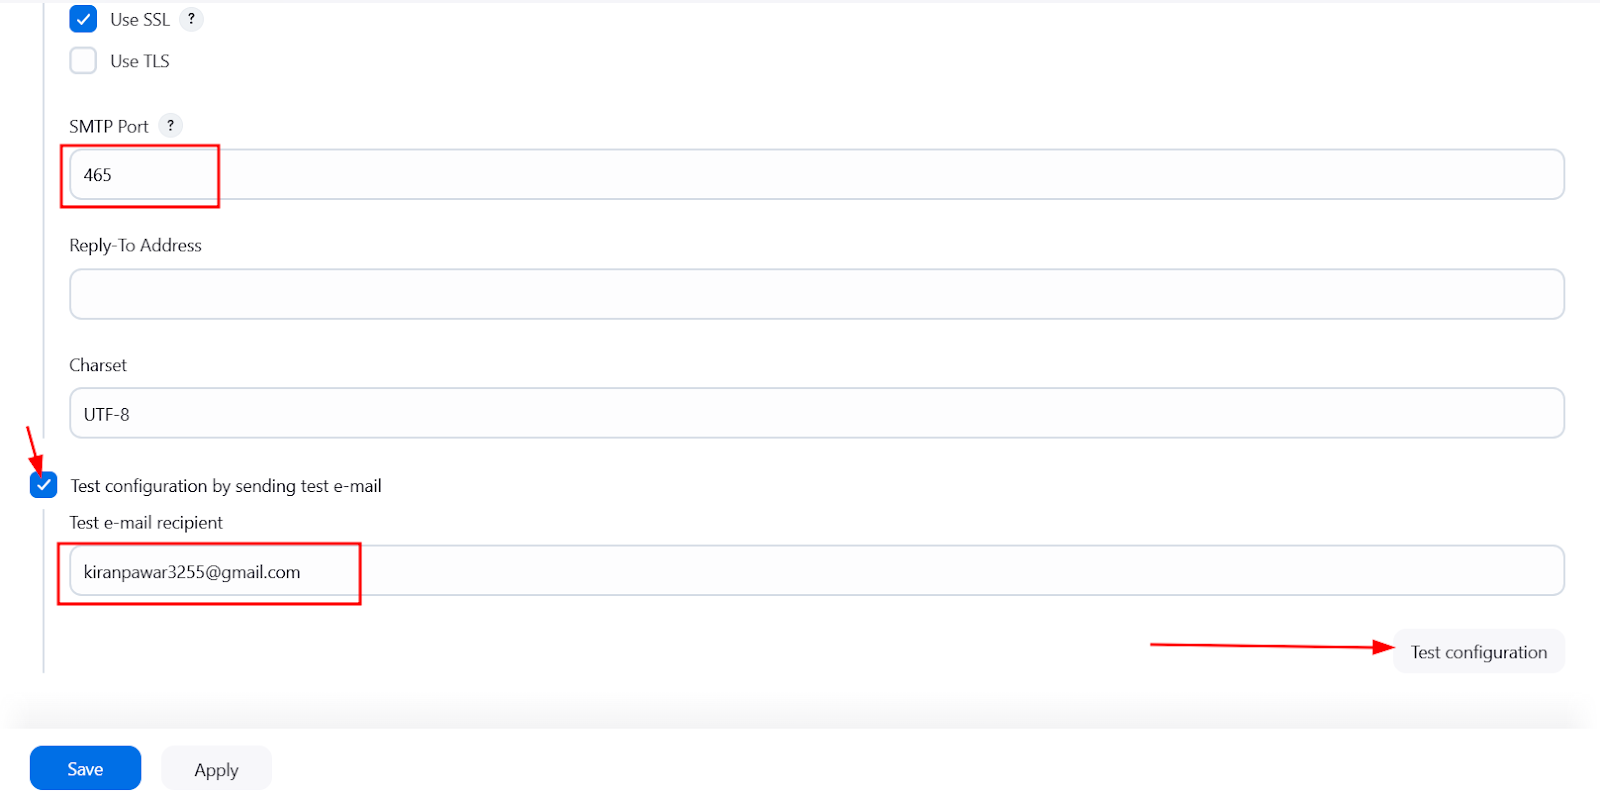
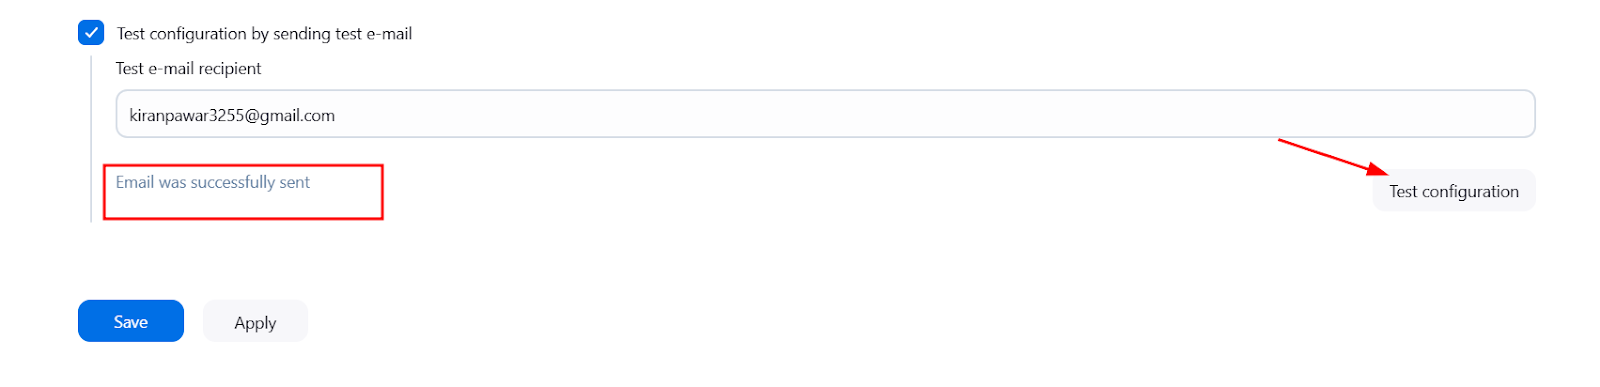
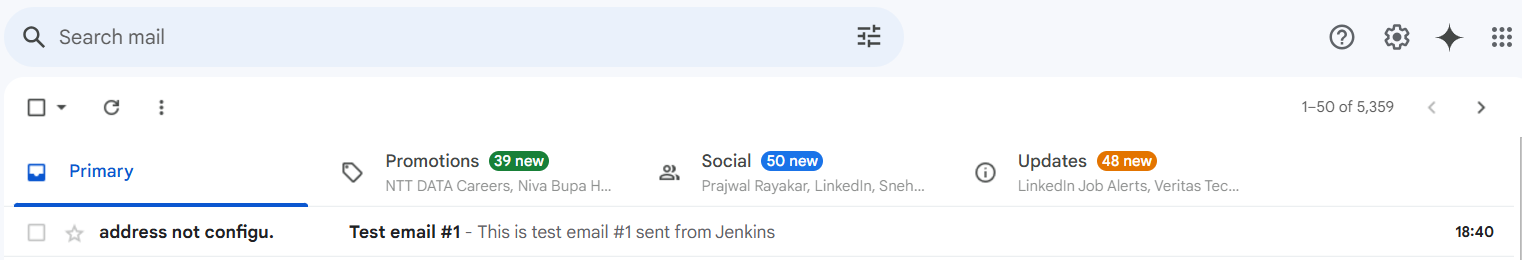
Go back to Manage Jenkins --> System and search for Extended E-mail Notification

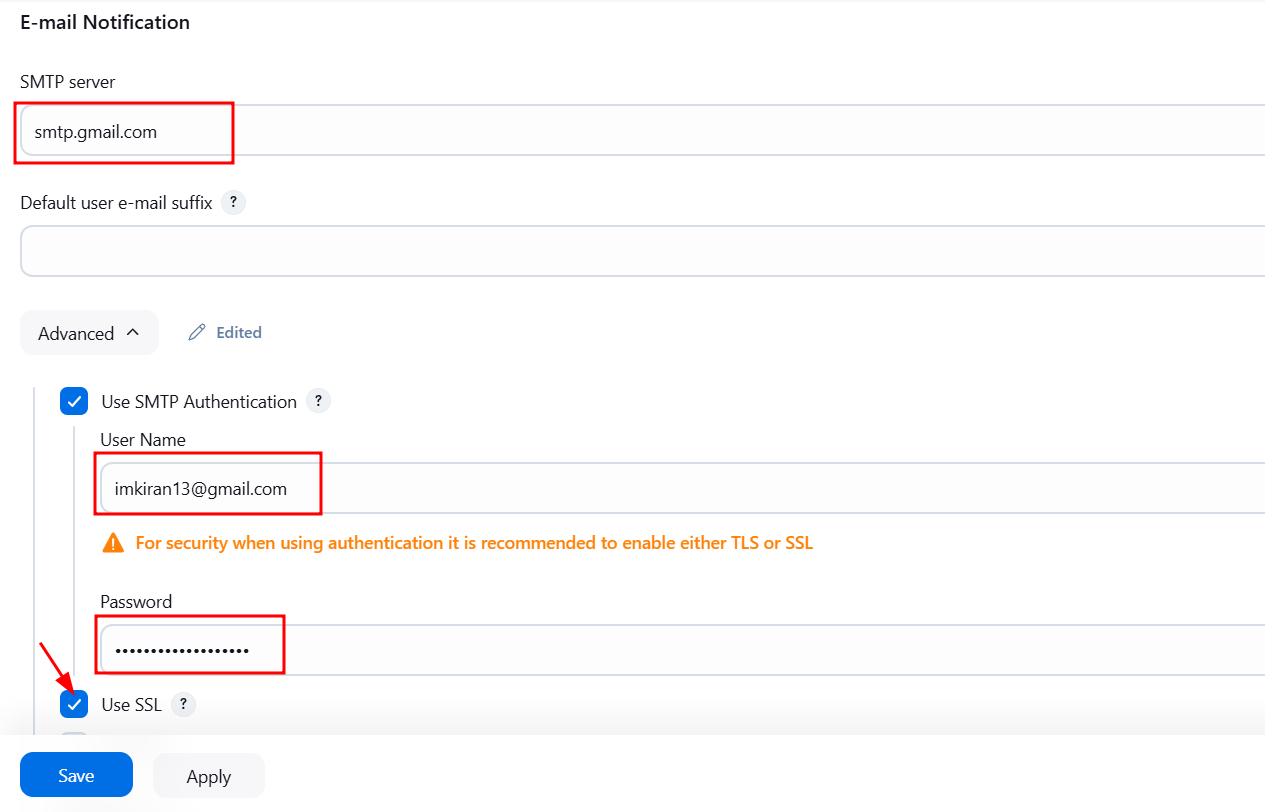
- Scroll down and search for E-mail Notification and setup email notification
Important
Enter your gmail password which we copied recently in password field
E-mail Notification --> Advance
Install and configure tools:
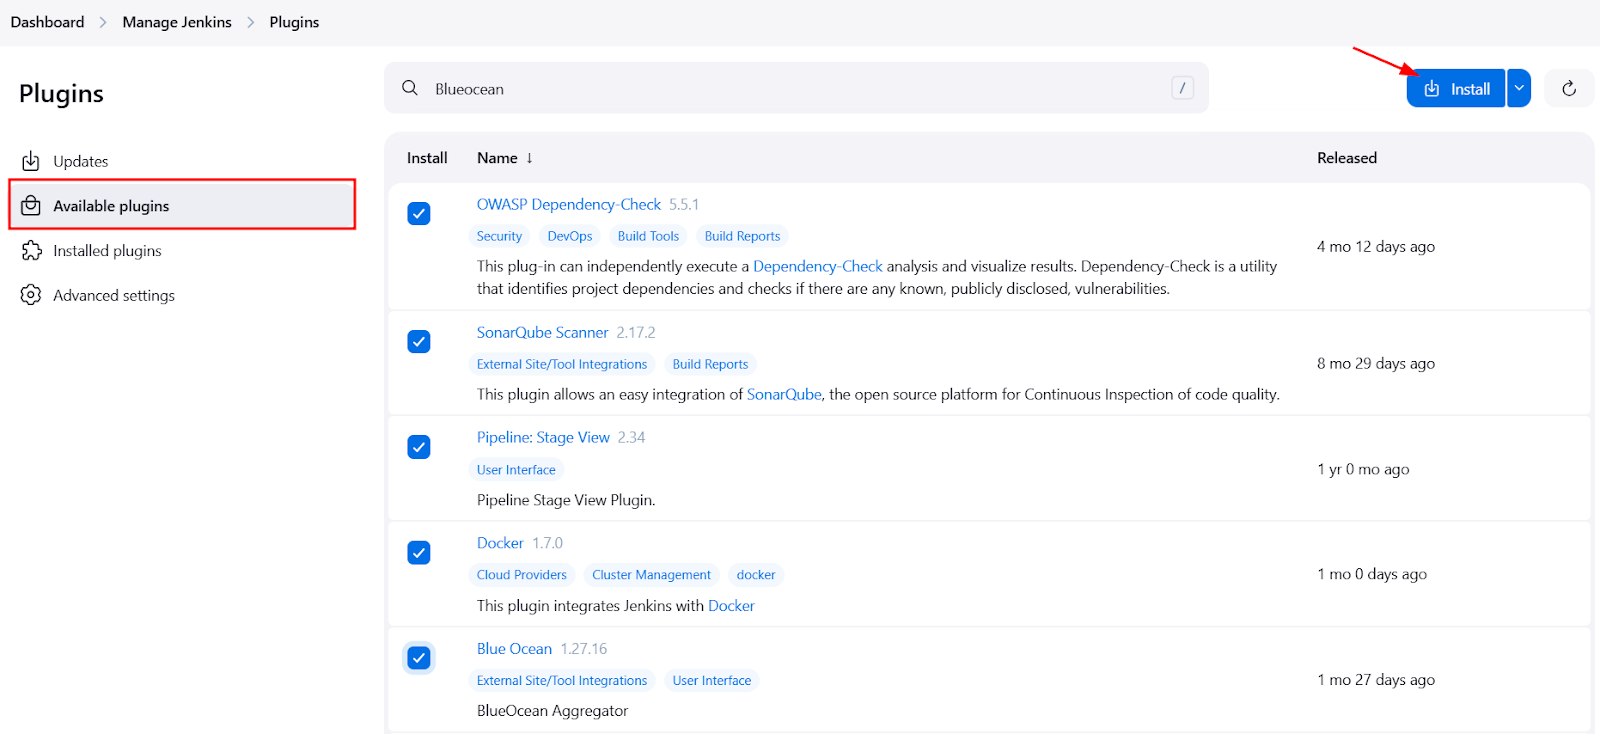
Go to Jenkins Master and click on Manage Jenkins --> Plugins --> Available plugins install the below plugins:
OWASP
SonarQube Scanner
Docker
Pipeline: Stage View
Blue ocean
After OWASP plugin is installed, Now move to Manage jenkins --> Tools
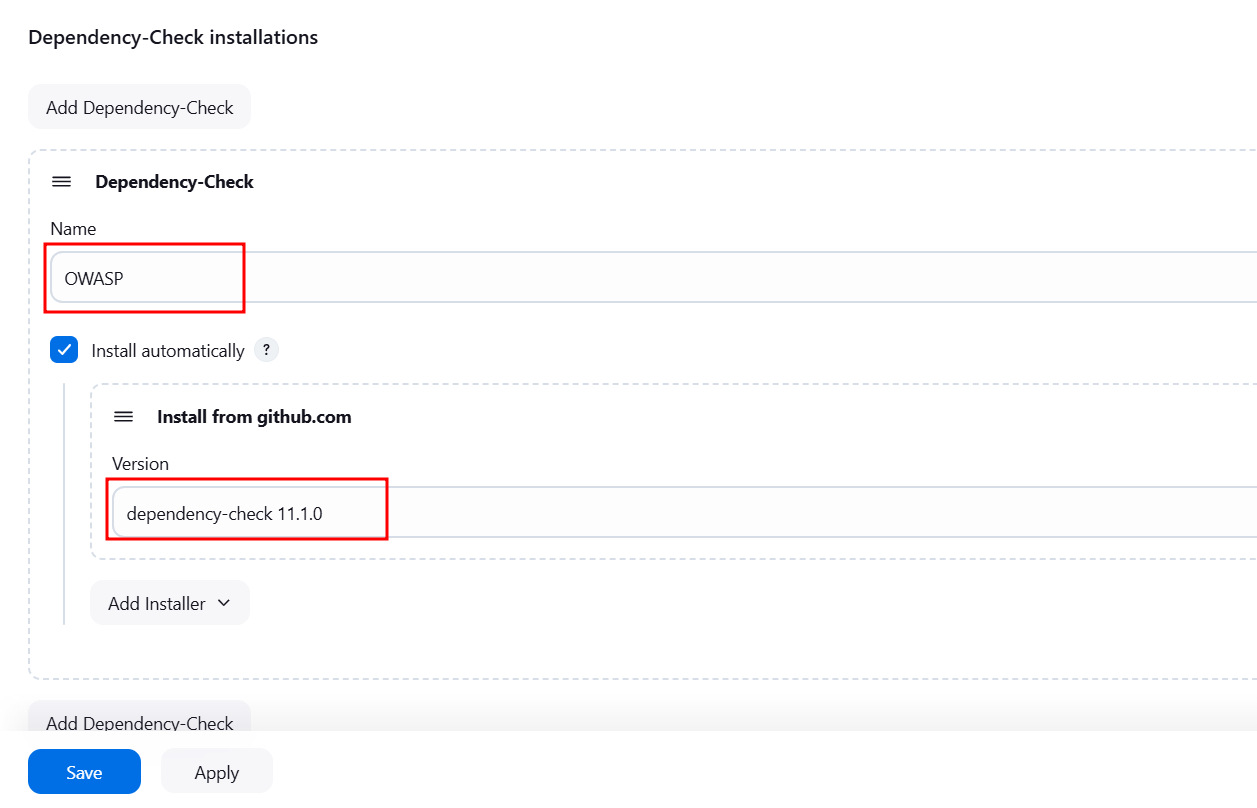
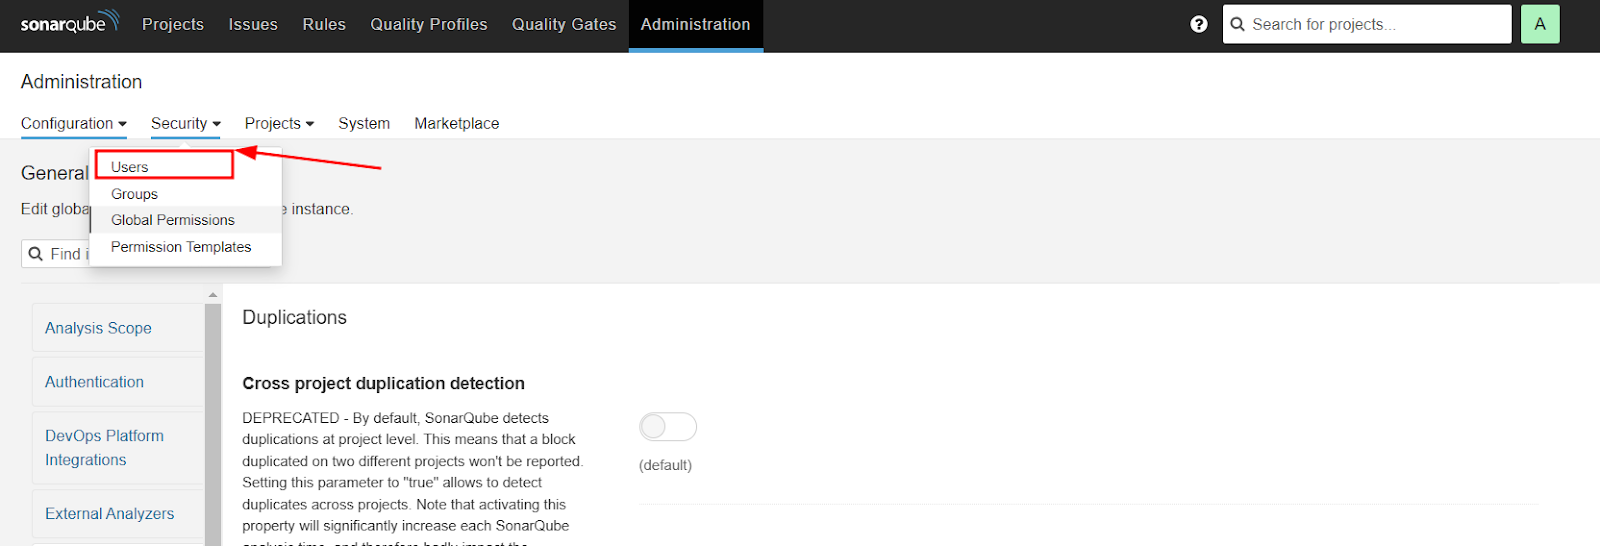
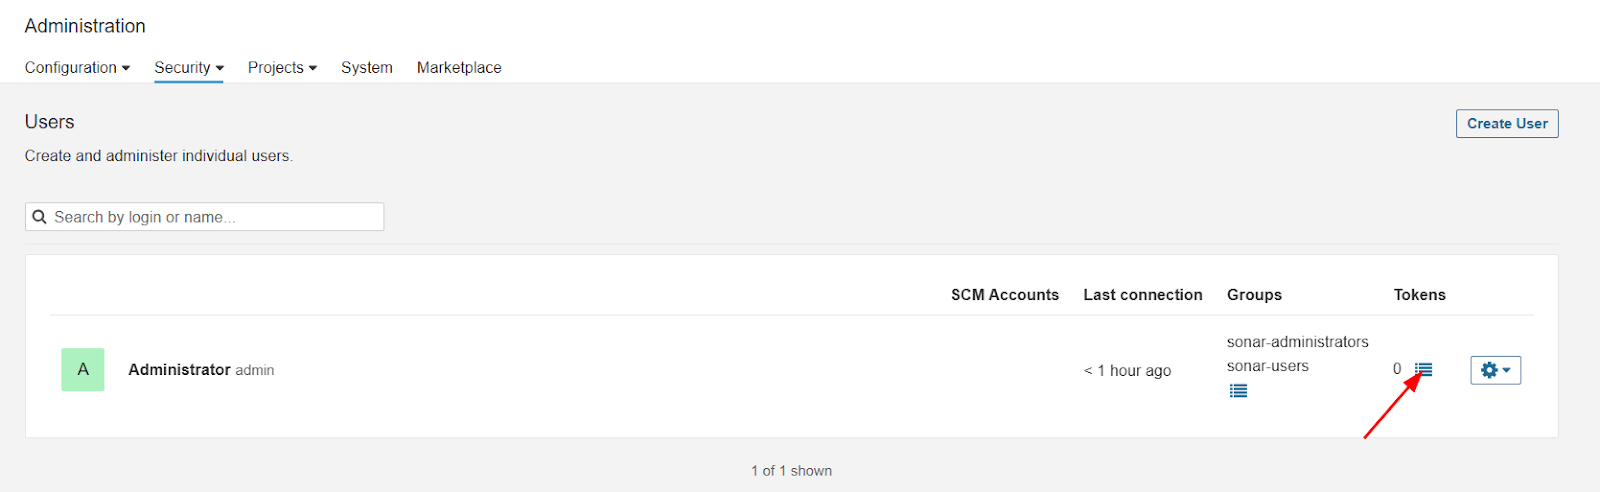
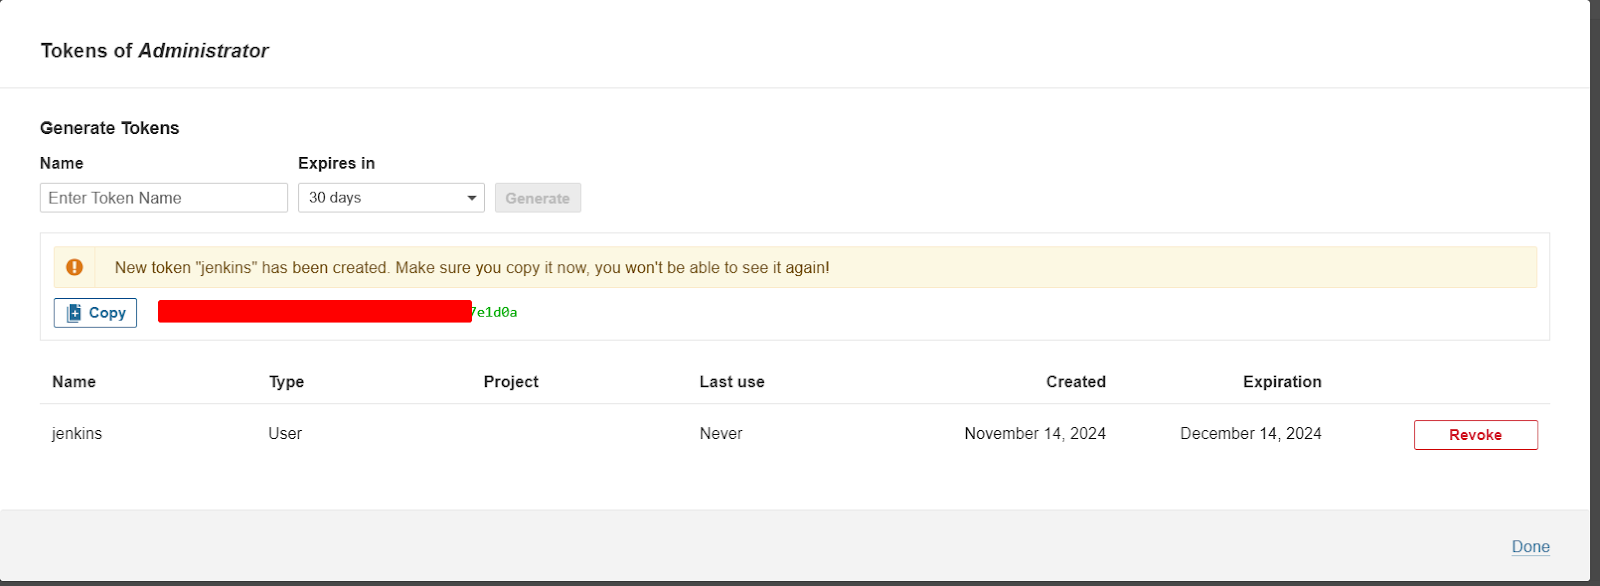
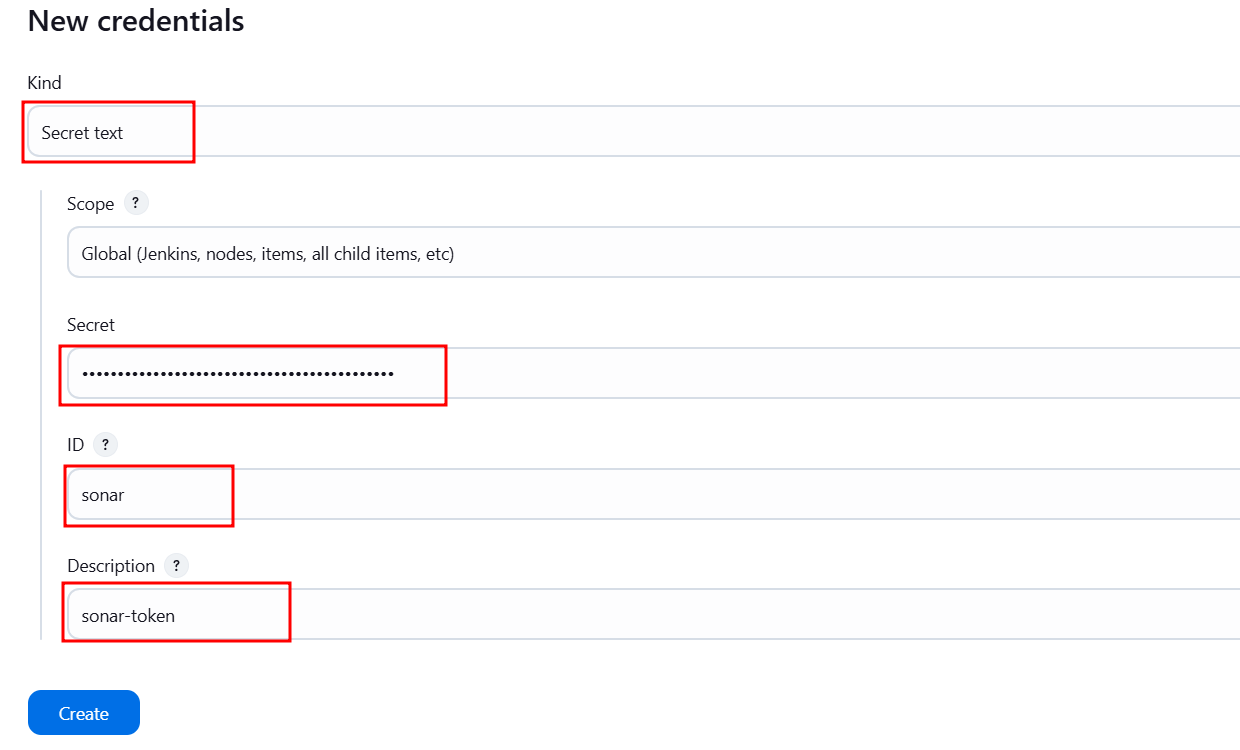
Login to SonarQube server and create the credentials for jenkins to integrate with SonarQube
Navigate to Administration --> Security --> Users --> Token
Now, go to Manage Jenkins --> credentials and add Sonarqube credentials:

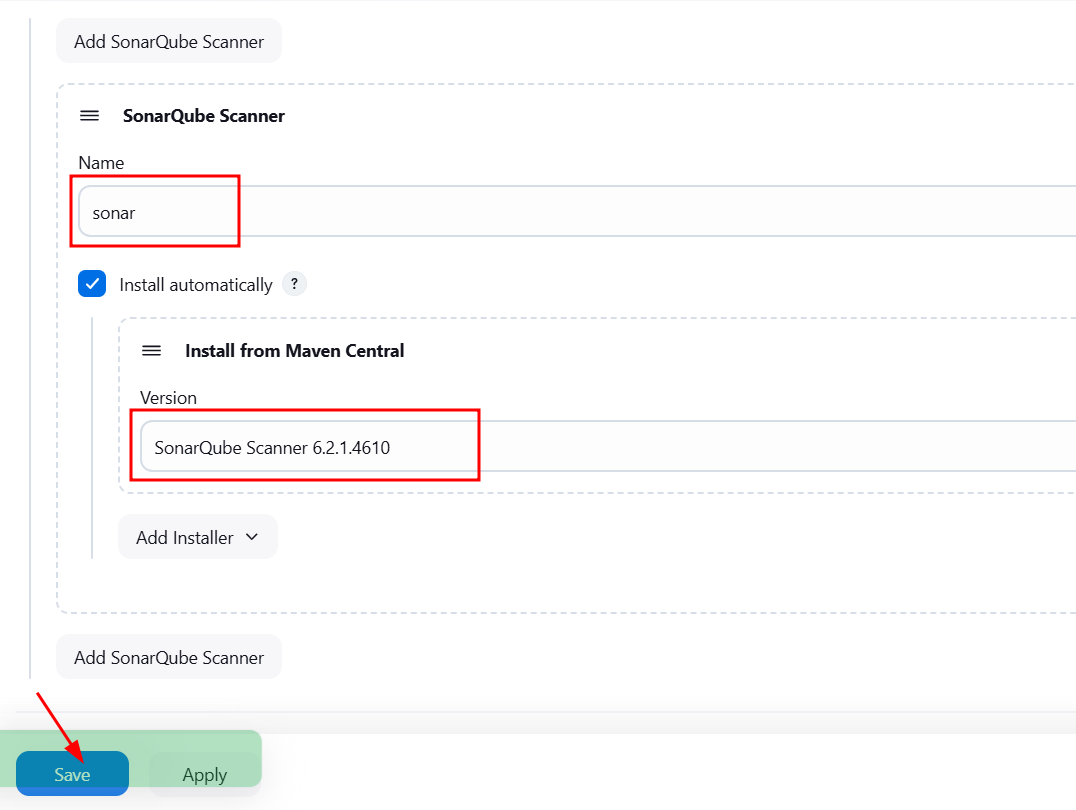
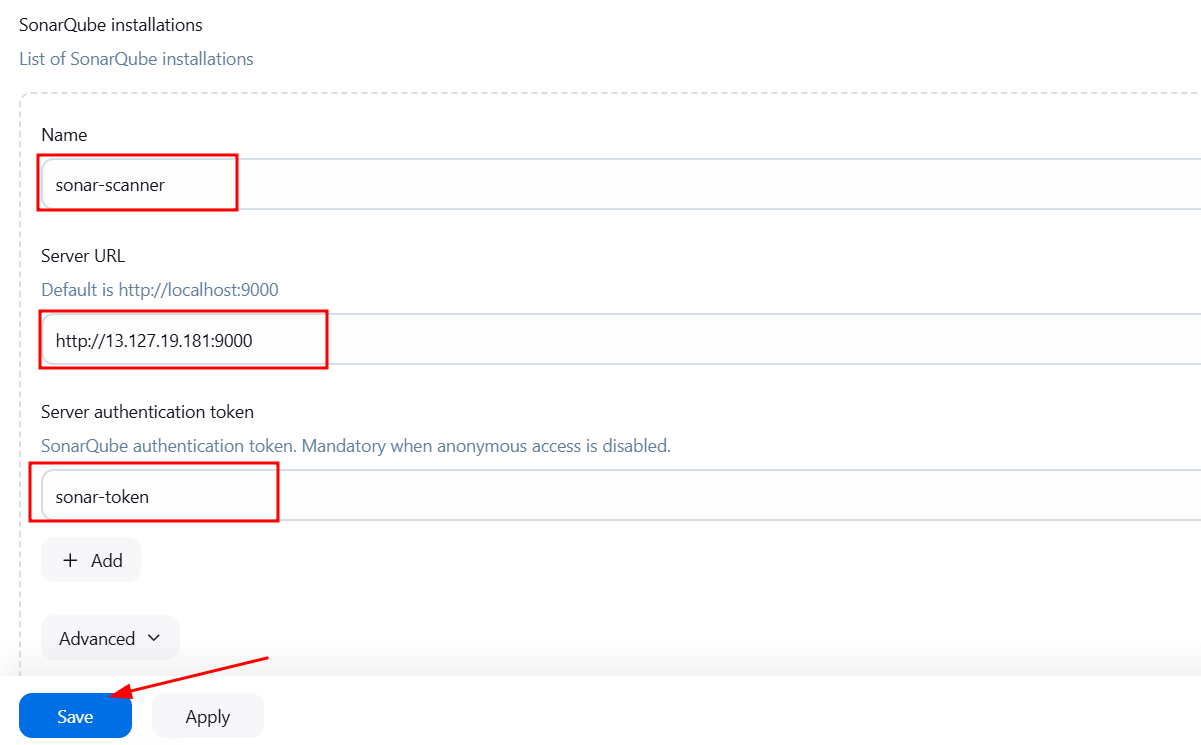
Go to Manage Jenkins --> Tools and search for SonarQube Scanner installations:
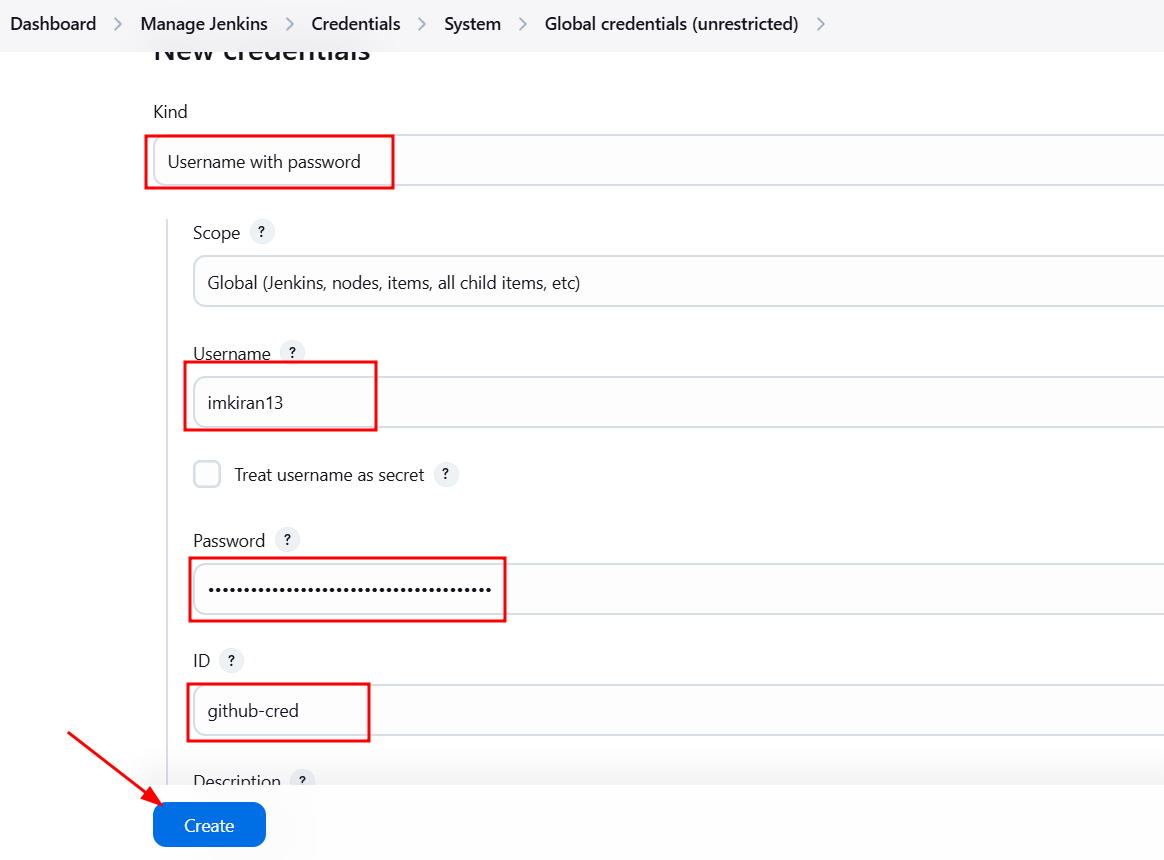
Create Github credentials
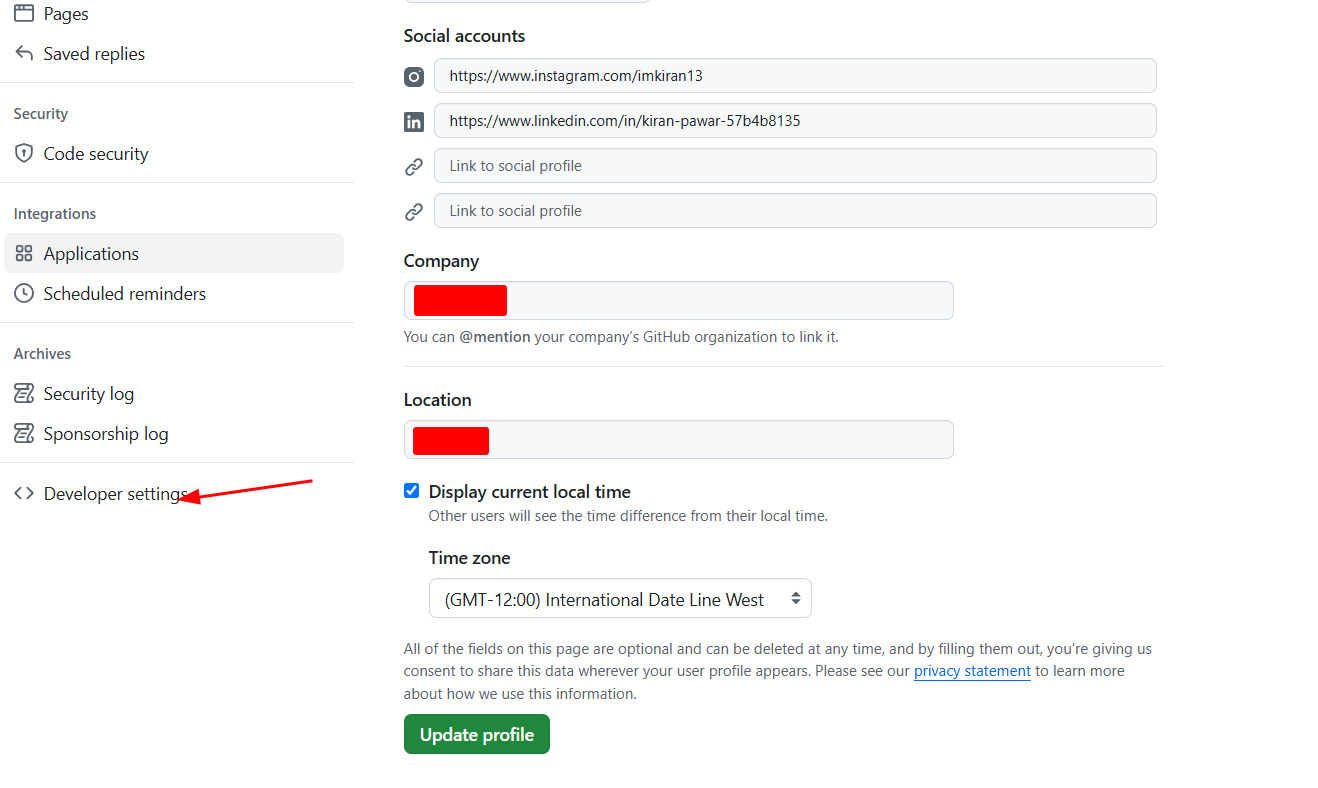
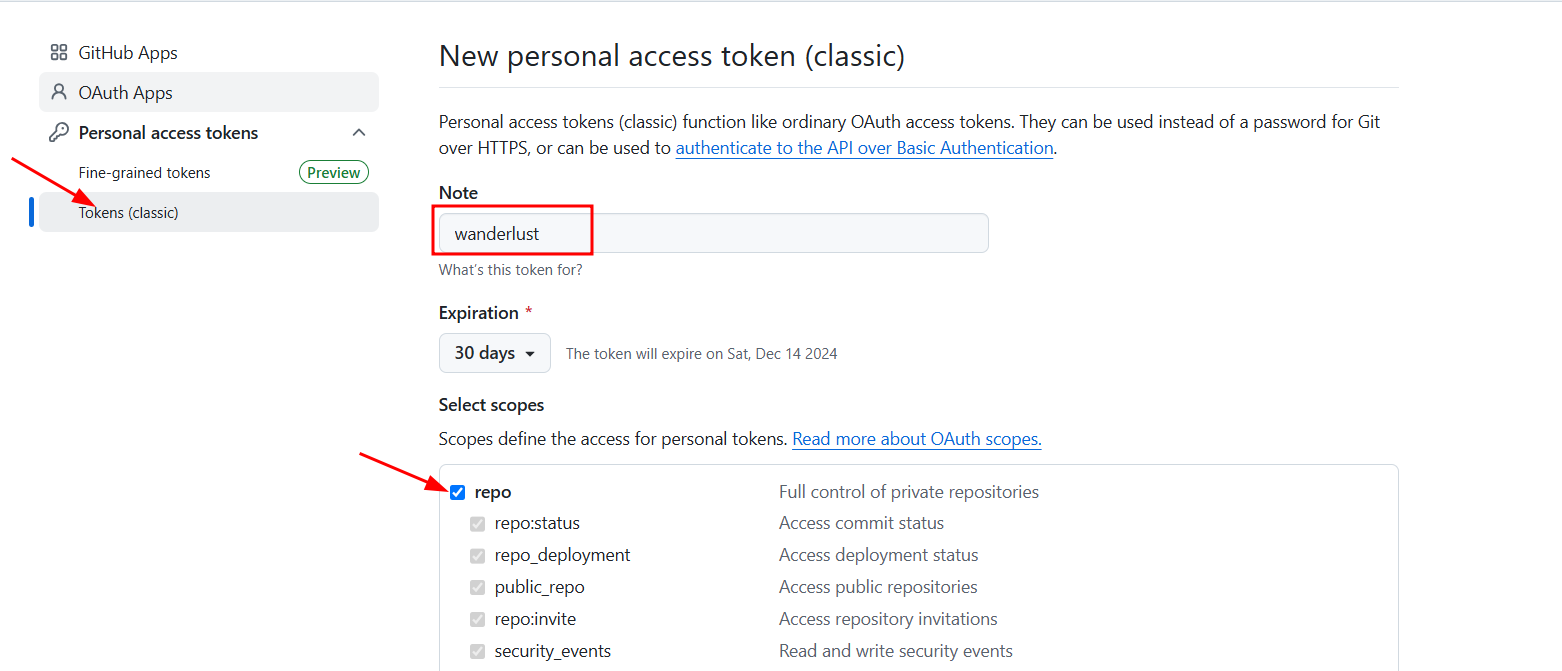
Settings →developer settings→Personal Access Token→create token
Note
While adding github credentials add Personal Access Token in the password field.
Go to Manage Jenkins --> credentials and add Github credentials to push updated code from the pipeline:
Go to Manage Jenkins --> System and search for SonarQube installations:
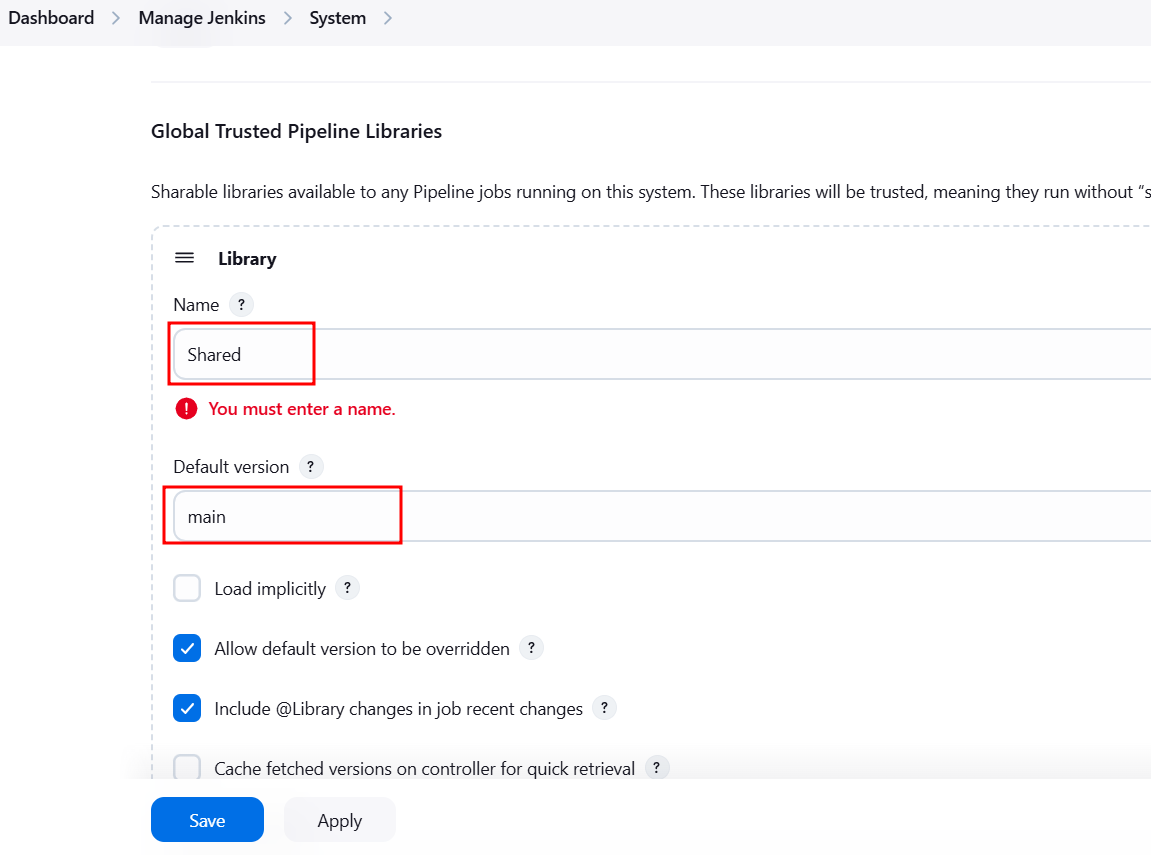
Now again, Go to Manage Jenkins --> System and search for Global Trusted Pipeline Libraries:

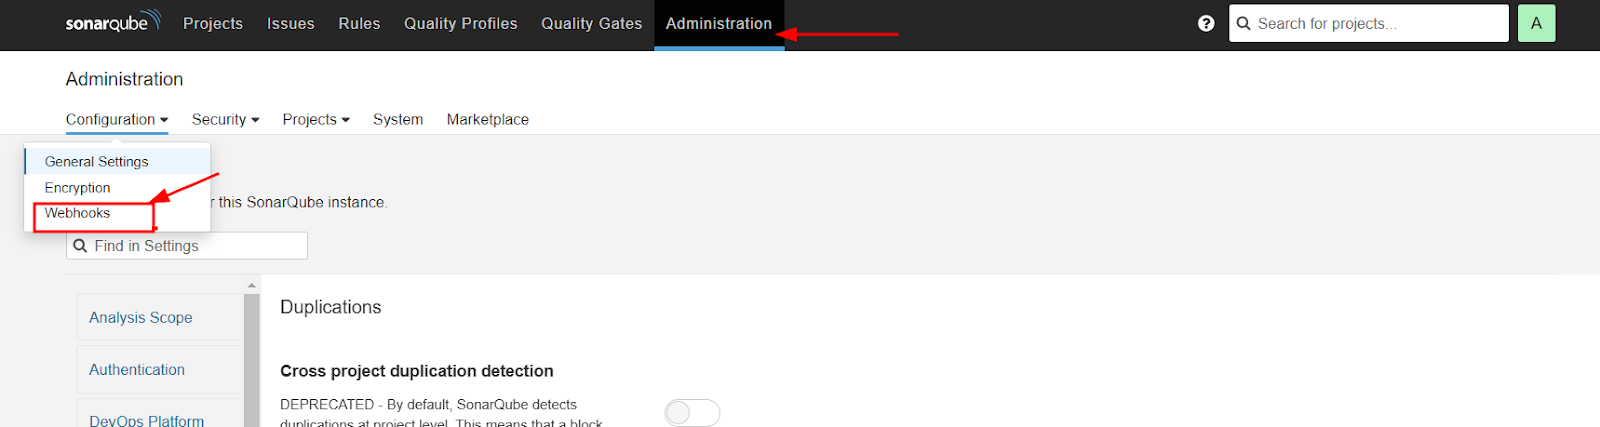
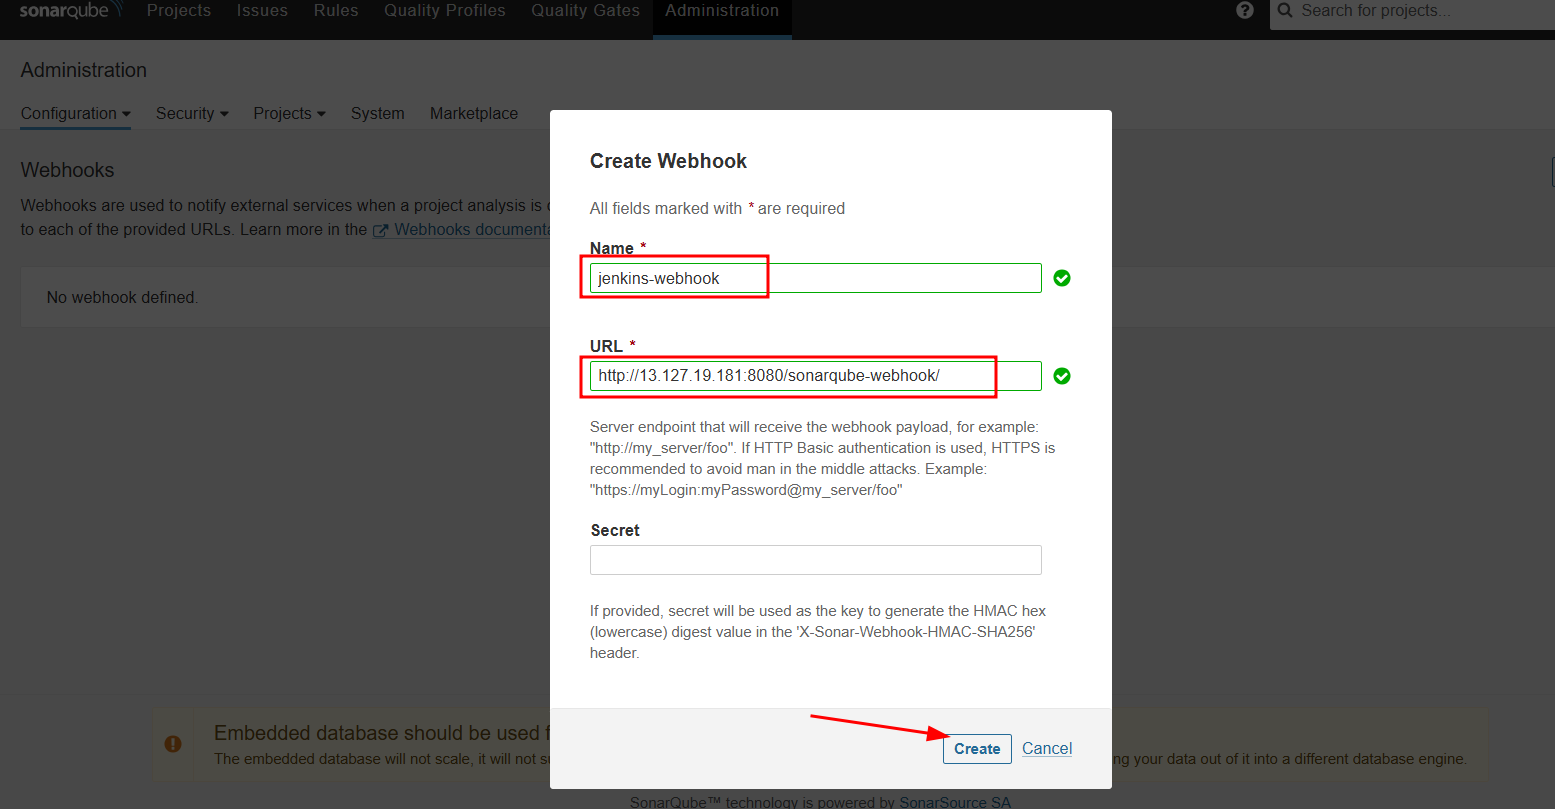
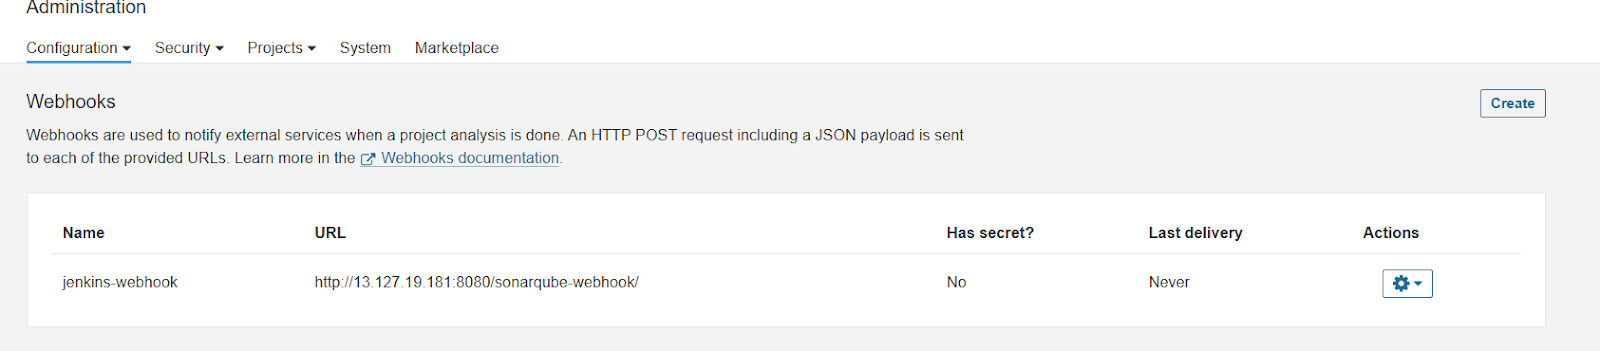
Login to SonarQube server, go to Administration --> Webhook and click on create
Create docker credentials
Create Access token for docker login
Login to dockerhub go to account-settings>Personal Access Token>create token


Copy generated token password

Navigate to Manage Jenkins --> credentials and add credentials for docker login to push docker image:


Install and Configure ArgoCD (Master Machine)
Install and Configure ArgoCD (Master Machine)
- Create argocd namespace
kubectl create namespace argocd
- Apply argocd manifest
kubectl apply -n argocd -f https://raw.githubusercontent.com/argoproj/argo-cd/stable/manifests/install.yaml
- Make sure all pods are running in argocd namespace
watch kubectl get pods -n argocd
- Install argocd CLI
sudo curl --silent --location -o /usr/local/bin/argocd https://github.com/argoproj/argo-cd/releases/download/v2.4.7/argocd-linux-amd64
- Provide executable permission
sudo chmod +x /usr/local/bin/argocd
- Check argocd services
kubectl get svc -n argocd
- Change argocd server's service from ClusterIP to NodePort
kubectl patch svc argocd-server -n argocd -p '{"spec": {"type": "NodePort"}}'
- Confirm service is patched or not
kubectl get svc -n argocd
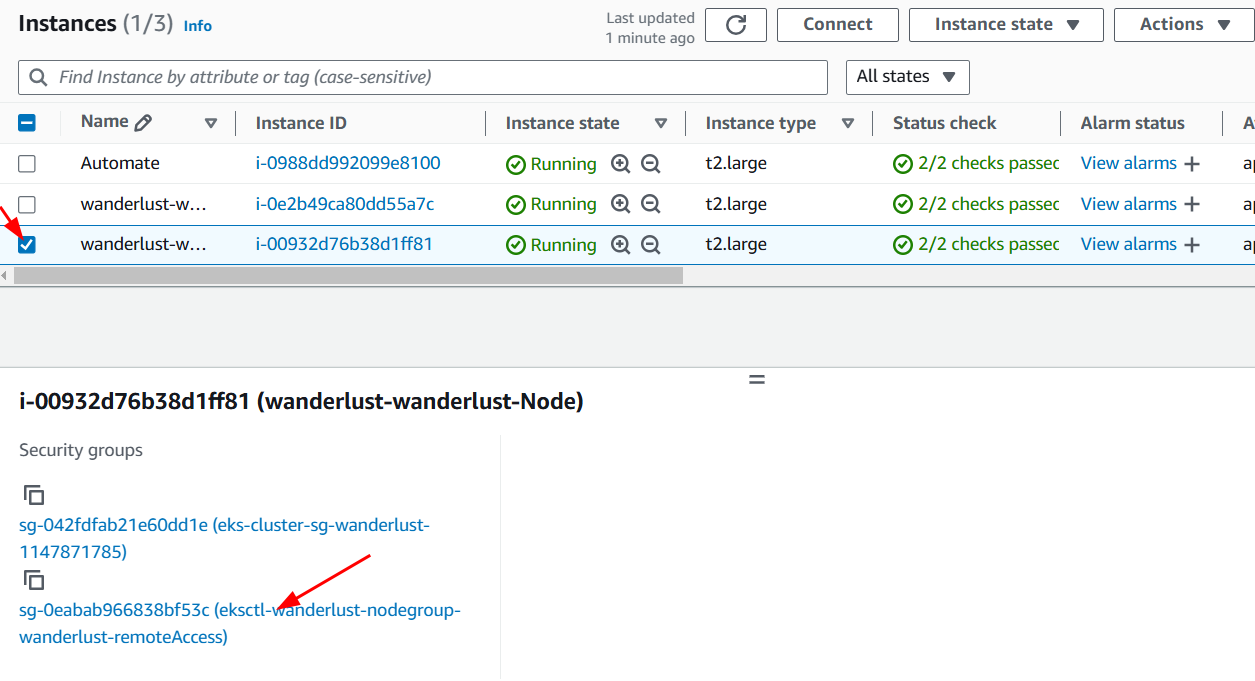
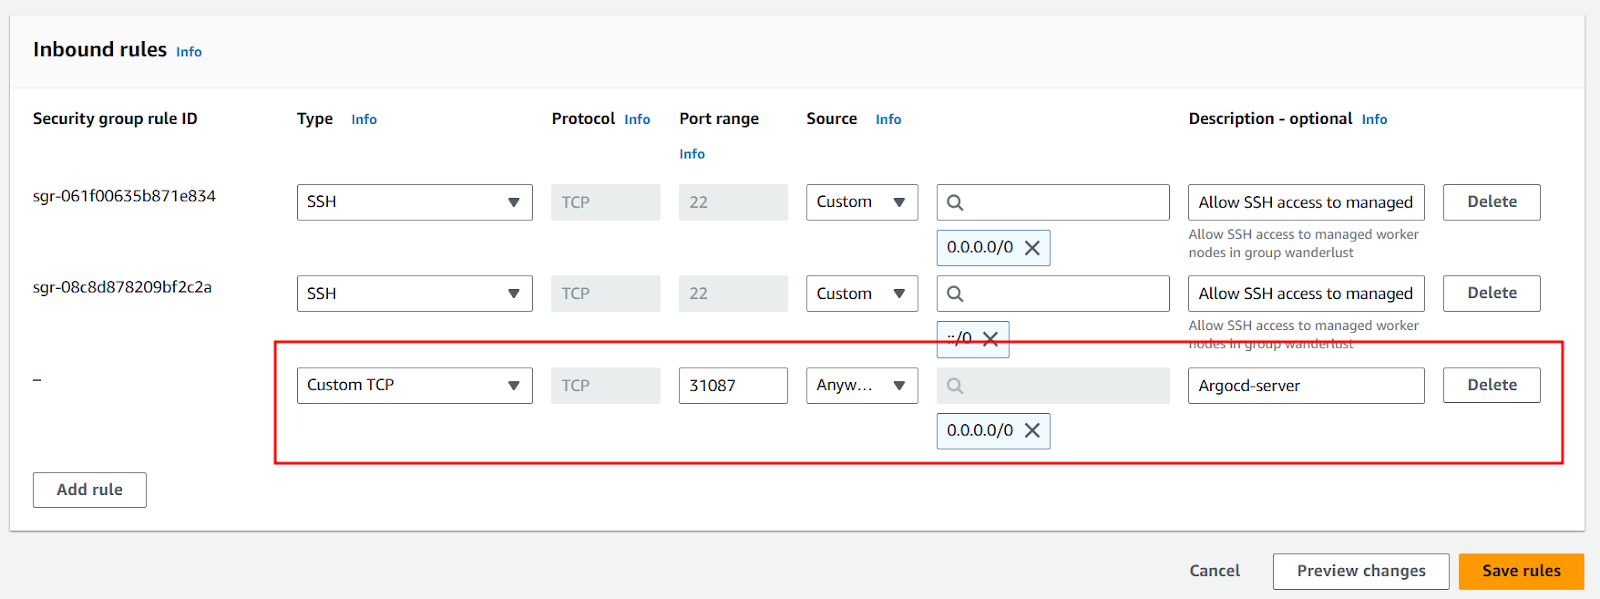
- Check the port where ArgoCD server is running and expose it on security groups of a worker node
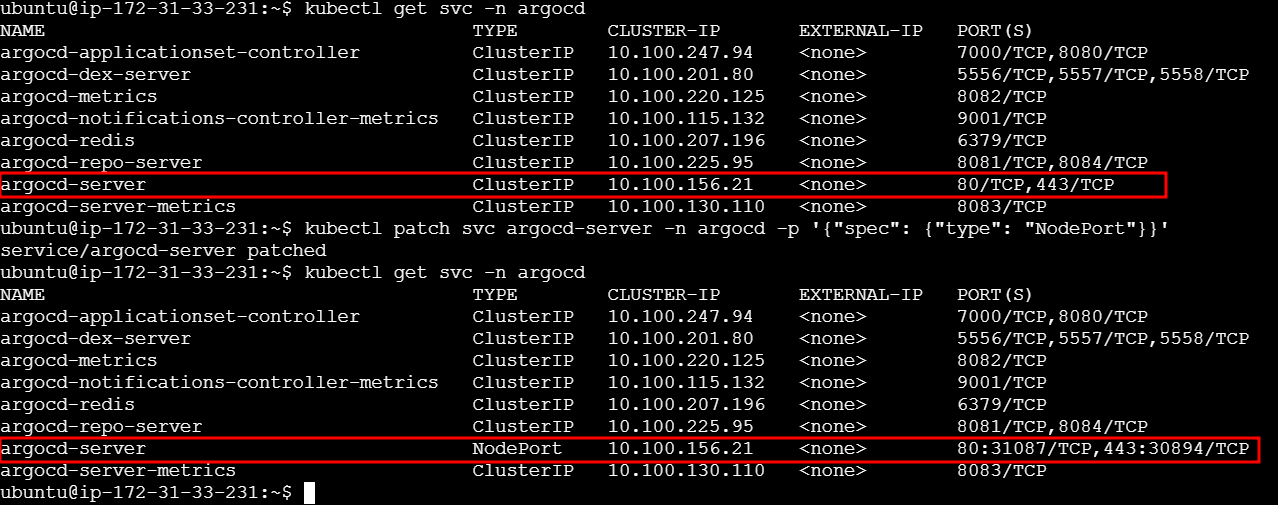
Check the port where ArgoCD server is running and expose it on security groups of a worker node
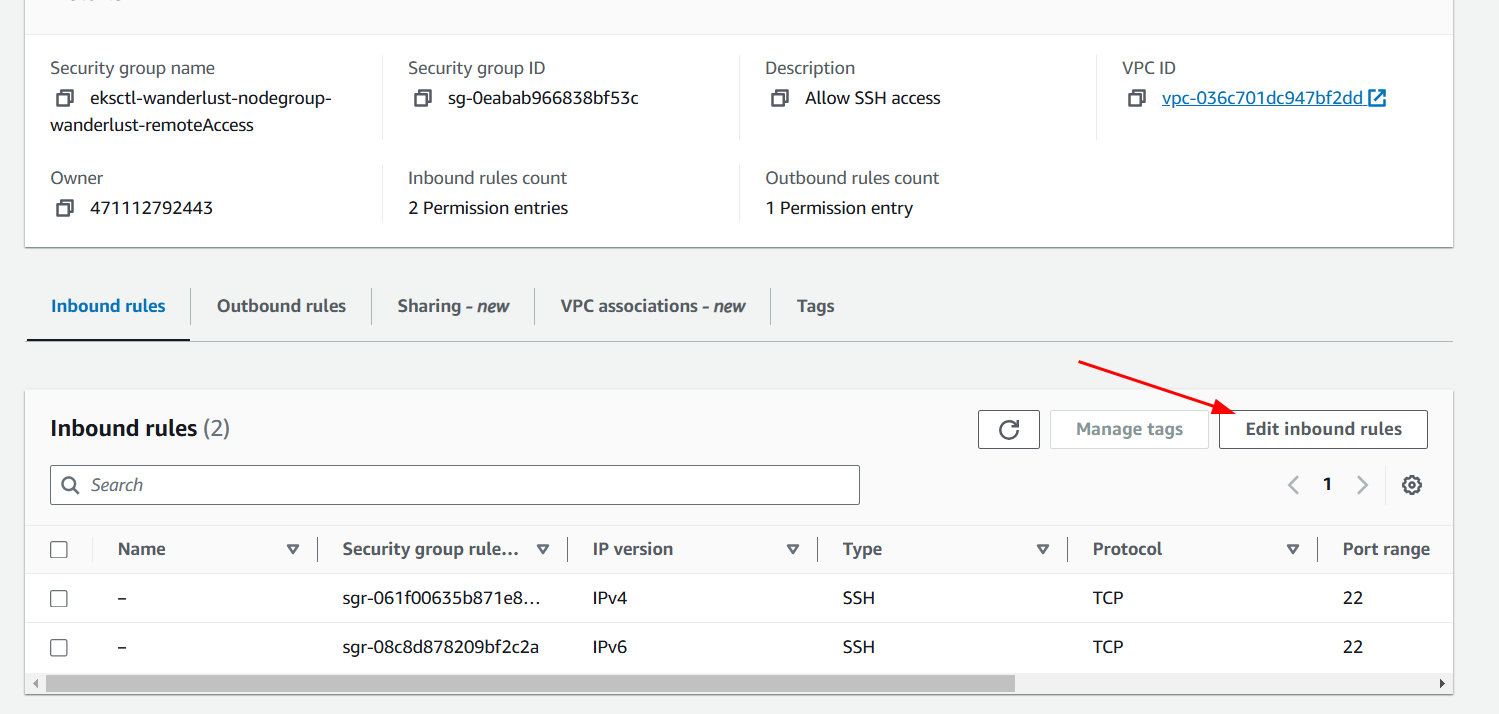
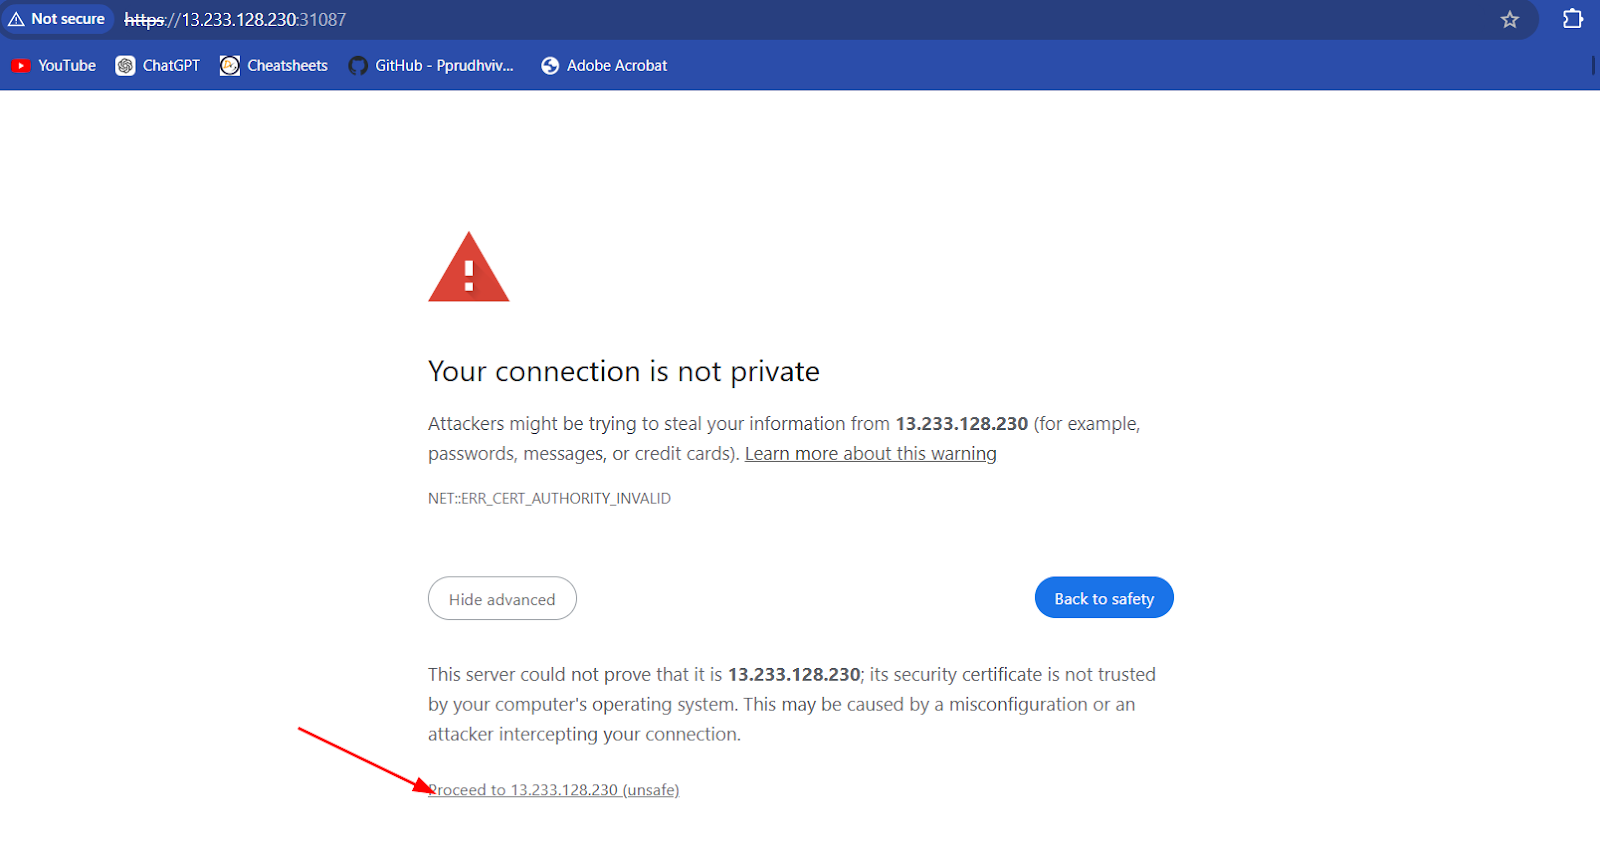
Access it on browser, click on advance and proceed with
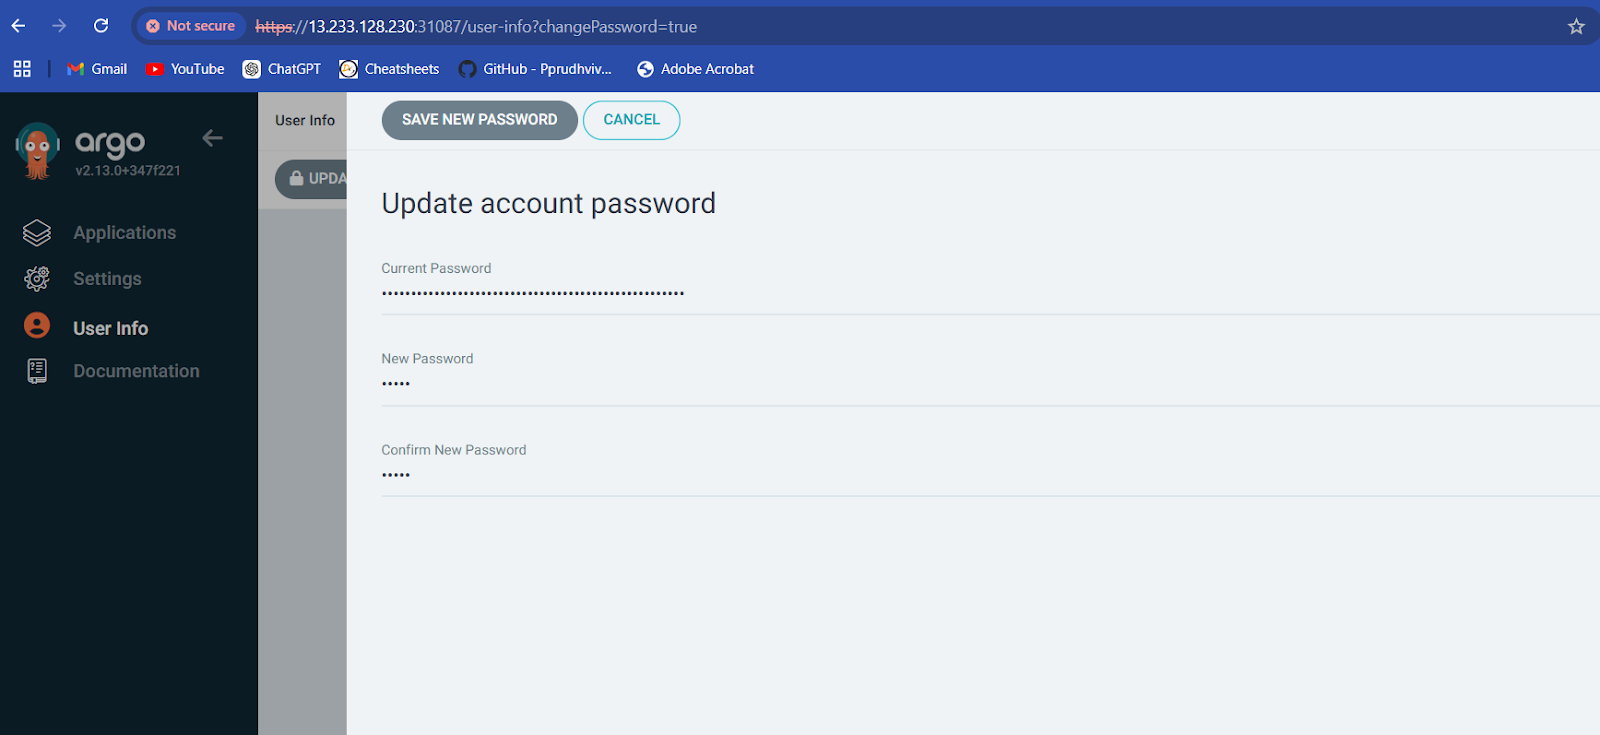
Fetch the initial password of argocd server
kubectl -n argocd get secret argocd-initial-admin-secret -o jsonpath="{.data.password}" | base64 -d; echo

Username: admin
Now, go to User Info and update your argocd password
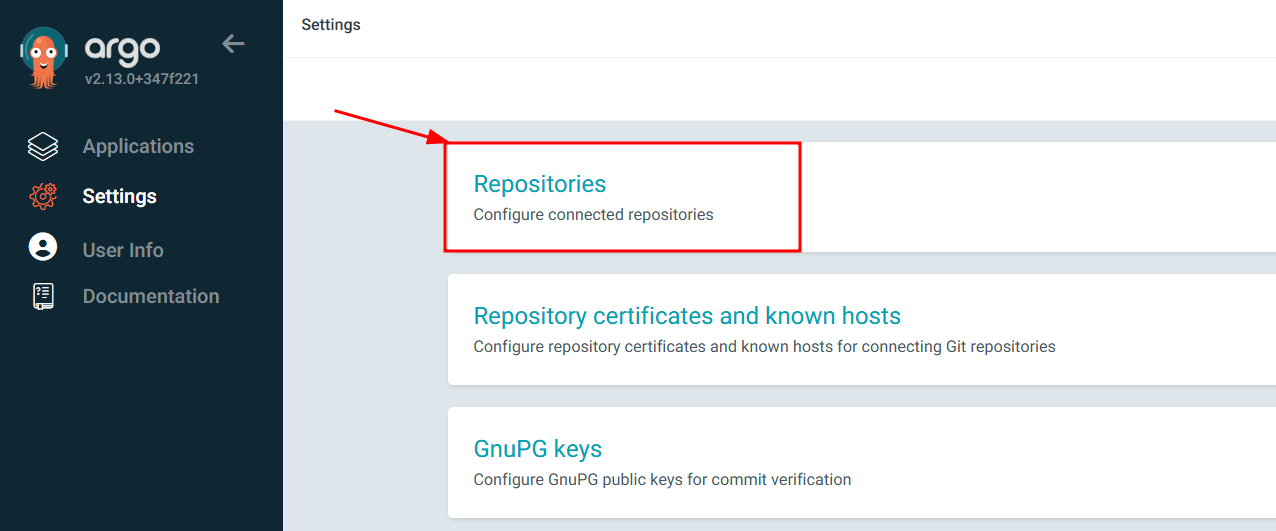
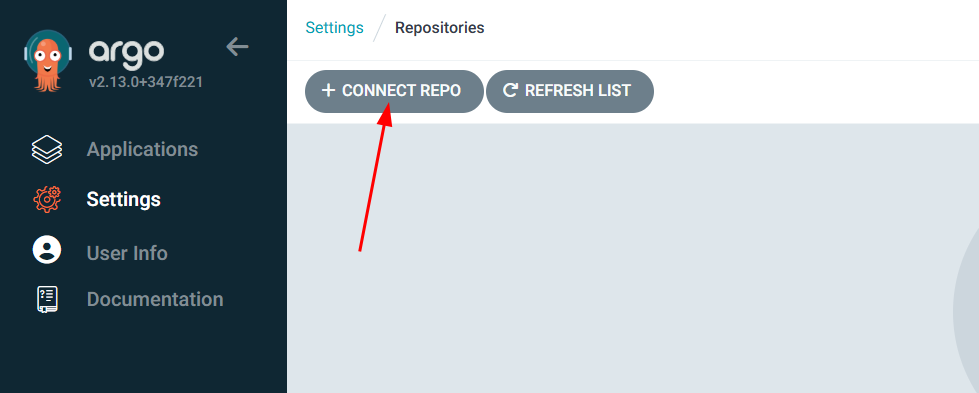
Setup repository
Go to Settings --> Repositories and click on Connect repo
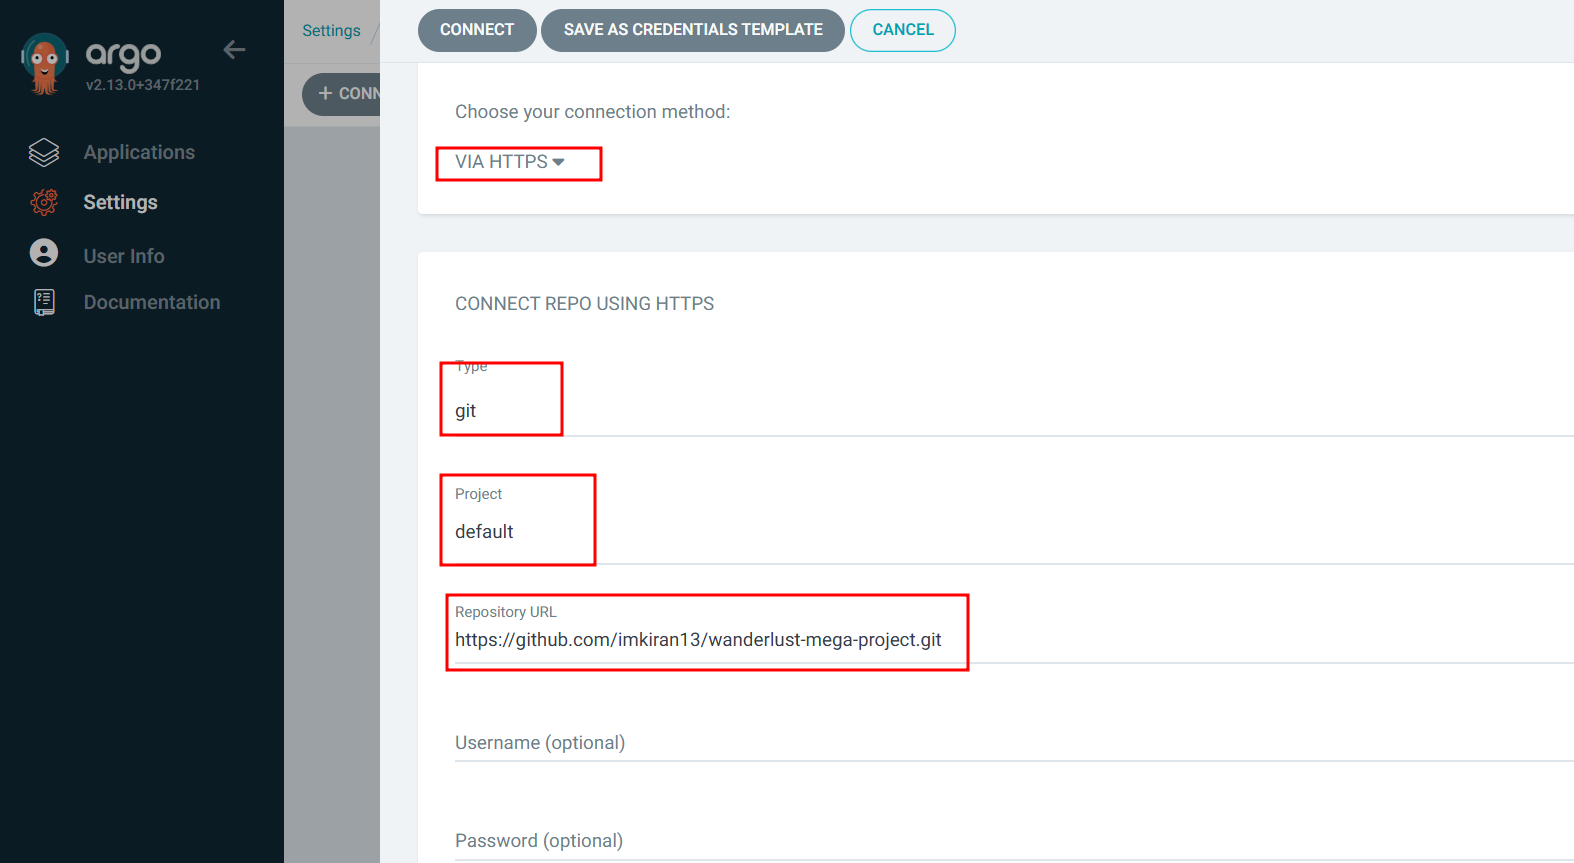
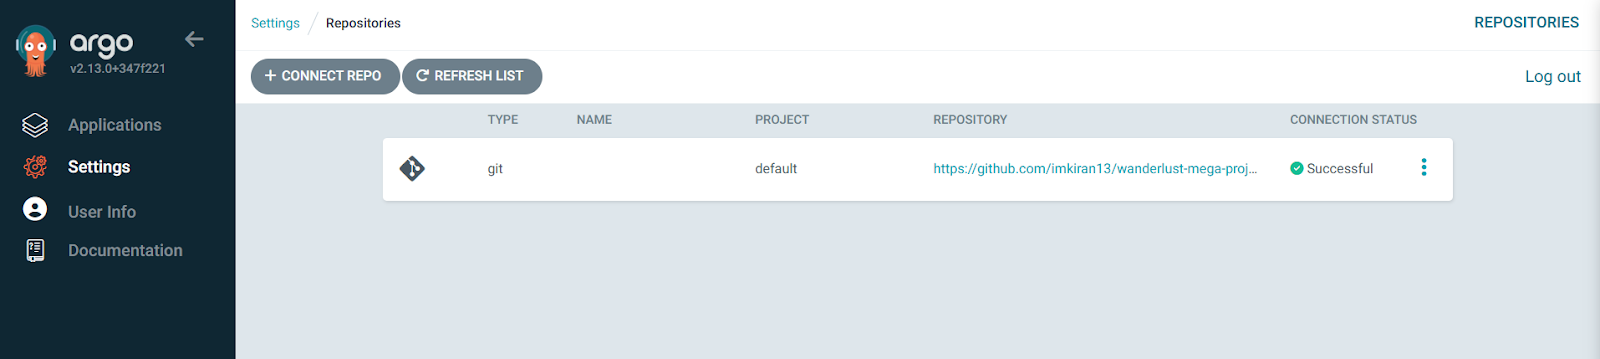
Note
Connection should be successful
Create CI Pipeline
Create a Wanderlust-CI pipeline


Save CI pipeline
Create CD Pipeline
Create one more pipeline wanderlust-CD


Save CD Pipeline
Add our own eks cluster to argocd for application deployment using cli

Copy argocd address
- Login to argoCD from CLI
argocd login 15.206.148.18:31261 --username admin

- Check how many clusters are available in argocd
argocd cluster list
- Get your cluster name
kubectl config get-contexts
- Add your cluster to argocd
argocd cluster add terraform-admin@wanderlust.ap-south-1.eksctl.io --name wanderlust-eks-cluster

Once your cluster is added to argocd, go to argocd console Settings --> Clusters and verify it


Go to Settings --> Repositories and click on Connect repo

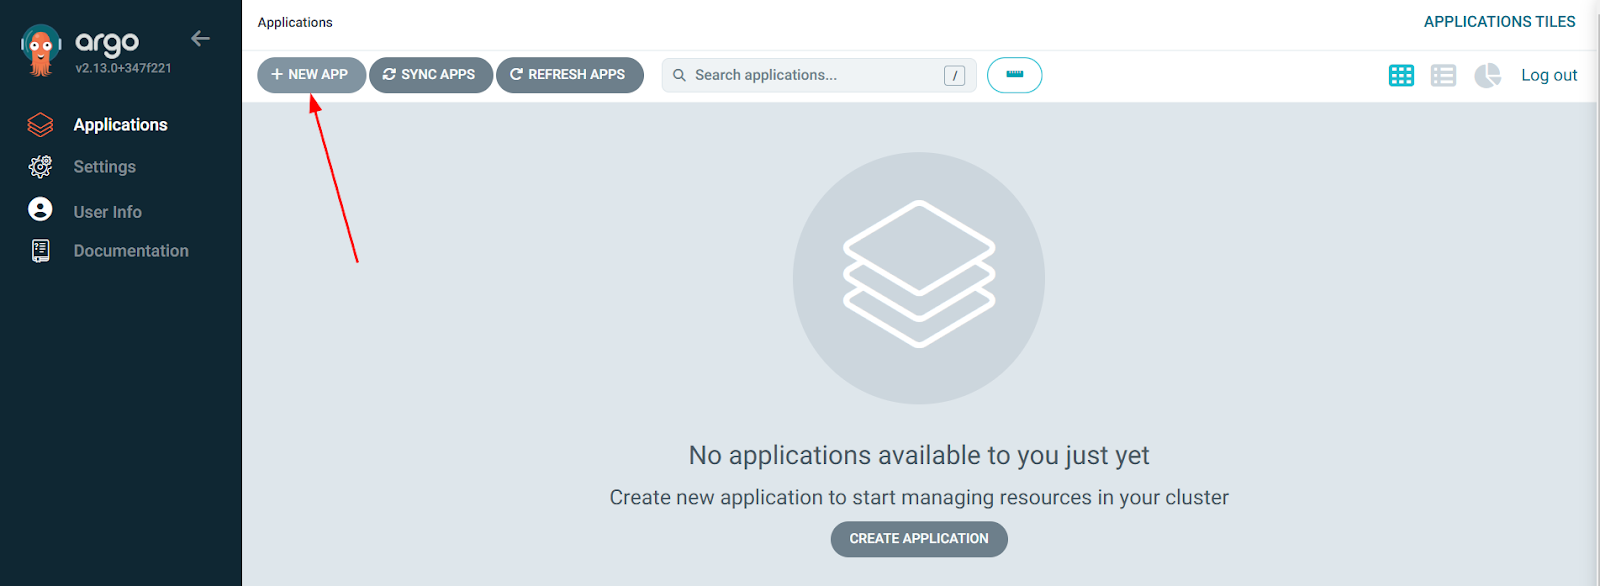
Now, go to Applications and click on New App
Make sure to click on the Auto-Create Namespace option while creating argocd application


Congratulations, your application is deployed on AWS EKS Cluster

Open port 31000 and 31100 on worker node in eks cluster security groud and Access it on browser


Access both frontend and backend in browser
#frontend app
<worker-public-ip>:31000

#backend app
<worker-public-ip>:31100


To update environment variable we need to update worker nodes public ip in CI pipeline

Copy insatnce ID of worker node and replace in project folder/automations/
updatebackendnew.sh and updatefrontendnew.sh
edit existing instance ID with this one
Now, go to github repository and under Automations directory update the instance-id field on both the updatefrontendnew.sh updatebackendnew.sh with the k8s worker's instance id


Provide permission to docker socket so that docker build and push command do not fail (master node)
sudo chmod 777 /var/run/docker.sock

Create IAM role for Master server (ie. automation)
we are creating this role for our jenkins user
while updating script in automations folder jenkins user need aws configure access


Role created succesfully

Click on actions

Select modify IAM role

Click on update IAM role
Run CI Pipeline

Go to build with parameters

Enter frontend and backend tags

Click on Build


Before triggering CD pipeline kubernetetes manifest frontend and backend tag was version v2


Lets Run CI pipeline with version v3 for both backend and frontend

Automatically Triggered CD Pipeline

After running CD pipeline version v3 is updated for both frontend and backend manifest


Check dockerhub for application backend fronted versions


Monitor EKS cluster, kubernetes components and workloads using prometheus and grafana via HELM
Install Helm Chart
curl -fsSL -o get_helm.sh https://raw.githubusercontent.com/helm/helm/main/scripts/get-helm-3
chmod 700 get_helm.sh
./get_helm.sh
- Add Helm Stable Charts for Your Local Client
helm repo add stable https://charts.helm.sh/stable
- Add Prometheus Helm Repository
helm repo add prometheus-community https://prometheus-community.github.io/helm-charts

- Create Prometheus Namespace
kubectl create namespace prometheus
kubectl get ns
- Install Prometheus using Helm
helm install stable prometheus-community/kube-prometheus-stack -n prometheus

- Verify prometheus installation
kubectl get pods -n prometheus
- Check the services file (svc) of the Prometheus
kubectl get svc -n prometheus

- Expose Prometheus and Grafana to the external world through Node Port
Important
change it from Cluster IP to NodePort after changing make sure you save the file and open the assigned nodeport to the service.
kubectl edit svc stable-kube-prometheus-sta-prometheus -n prometheus

- Verify service
kubectl get svc -n prometheus

- Now,let’s change the SVC file of the Grafana and expose it to the outer world
kubectl edit svc stable-grafana -n prometheus

- Check grafana service
kubectl get svc -n prometheus

Expose grafana and prometheus ports in Cluster security groups


Select inbound rules

Edit port for grafana prometheus

Copy nodes public ip and access grafana prometheus on respective ports

Access grafana on port 31645 as exposed by nodeport

- Get a password for grafana
kubectl get secret --namespace prometheus stable-grafana -o jsonpath="{.data.admin-password}" | base64 --decode ; echo
Note
Username: admin
Now, view the Dashboard in Grafana

Access prometheus dashboard on port 30131 exposed by nodeport

Check targets


Go to grafana and see dashboard to monitor our kubernetes cluster

Grafana Dashboard

Email Notification
Pipeline success

Failure of pipeline

ArgoCD Dashboard

Access Application on frontend port 31000 on worker node public ip


Clean Up
- Delete eks cluster
eksctl delete cluster --name=wanderlust --region=ap-south-1
